
| SRK Consulting (Peru) SA Av. La Paz 1227, Miraflores Lima 18, Perú Tel: +511 206 5900 Email: srk@srk.com.pe |

CONSENT OF SRK CONSULTING (PERU) SA
SRK Consulting (Peru) SA (“SRK”), a “qualified person” for purposes of Subpart 1300 of Regulation S-K as promulgated by the U.S. Securities and Exchange Commission (“S-K 1300”), in connection with Compañia de Minas Buenaventura S.A.A.’s (the “Company”) Annual Report on Form 20-F for the year ended December 31, 2021 and any amendments or supplements and/or exhibits thereto (collectively, the “Form 20-F”), consent to:
| ● | the public filing by the Company and use of the technical report titled “SEC Technical Report Summary Pre-Feasibility Study for El Brocal” (the “Technical Report Summary”), with an effective date of March 15th, 2022, which was prepared in accordance with S-K 1300, as an exhibit to and referenced in the Annual Report; |
| ● | the use of and references to SRK, including the status as an expert “qualified person” (as defined in Sub-Part S-K 1300), in connection with the Form 20-F and any such Technical Report Summary; and |
| ● | the use of information derived, summarized, quoted or referenced from those sections of Technical Report Summary, or portions thereof, for which SRK is responsible and which is included or incorporated by reference in the Annual Report. |
SRK is responsible for authoring, and this consent pertains to, the following sections of the Technical Report Summary:
| ● | 1.1, 1.2, 1.3.1, 1.3.2, 1.3.3, 1.3.4, 1.3.5, 1.3.6, 1.3.7, 1.3.8, 1.3.9, 1.3.10, 1.3.12, 1.3.13, 1.3.14, 2, 3, 4, 5, 6, 7, 8, 9, 10, 11, 12, 13.1.1, 13.2, 13.3, 13.4, 13.5, 14, 15.1, 15.3, 15.4, 15.5, 15.6, 15.7, 15.8, 15.9, 17, 18, 19, 20, 21, 22.1, 22.2, 22.3, 22.4, 22.5, 22.6, 22.7, 22.9, 23, 24, 25 and Appendixes. |
Dated this May 11th, 2022 | |
| |
| |
Angel Mondragon | |
SRK Consulting (Peru) S.A. - Director | |

| |
Antonio Samaniego | |
SRK Consulting (Peru) S.A. - Director | |

| Amphos 21 |
Av. Primavera 785, Int. 201, | |
Urb. Chacarilla - San Borja, | |
| Lima 41, Perú |
| Telf. +51 1 5921275 |
| www.amphos21.com |

CONSENT OF DAVID ARCOS BOSCH
I, David Arcos Bosch, in connection with the filing of Compañía de Minas Buenaventura S.A.A.’s (the “Company”) Annual Report on Form 20-F for the year ended December 31, 2021 (the “Annual Report”), consent to:
| ● | the public filing and use of the technical report summary titled “SEC Technical Report Summary Pre-Feasibility Study for El Brocal” with an effective date of March 15, 2022 (the “Technical Report Summary”), as an exhibit to and referenced in the Annual Report; |
| ● | the use of and reference to our name, including our status as an expert or “qualified person” (as defined in S-K 1300), in connection with the Annual Report and the Technical Report Summary; and |
| ● | the information derived, summarized, quoted or referenced from those sections of the Technical Report Summary, or portions thereof, for which David Arcos Bosch is co-responsible that is included or incorporated by reference in the Annual Report. |
This consent pertains to the following sections of the Technical Report Summary:
| ● | Section 13.1.2 |
Dated this 6 day of May, 2022.

Name: David Arcos Bosch, PhD. Geological Engineer, EurGeol (Reg. 1186) Title: Qualified Person, Senior Geologist and Geochemist consultant
| Amphos 21 |
Av. Primavera 785, Int. 201, | |
Urb. Chacarilla - San Borja, | |
| Lima 41, Perú |
| Telf. +51 1 5921275 |
| www.amphos21.com |
CONSENT OF EDUARDO RUIZ DELGADO
I, Eduardo Ruiz Delgado, in connection with the filing of Compañía de Minas Buenaventura S.A.A.’s (the “Company”) Annual Report on Form 20-F for the year ended December 31, 2021 (the “Annual Report”), consent to:
| ● | the public filing and use of the technical report summary titled “SEC Technical Report Summary Pre-Feasibility Study for El Brocal” with an effective date of March 15, 2022 (the “Technical Report Summary”), as an exhibit to and referenced in the Annual Report; |
| ● | the use of and reference to our name, including our status as an expert or “qualified person” (as defined in S-K 1300), in connection with the Annual Report and the Technical Report Summary; and |
| ● | the information derived, summarized, quoted or referenced from those sections of the Technical Report Summary, or portions thereof, for which Eduardo Ruiz Delgado is co-responsible that is included or incorporated by reference in the Annual Report. |
This consent pertains to the following sections of the Technical Report Summary:
| ● | Section 13.1.2 |
Dated this 6 day of May, 2022.

Name: Eduardo Ruiz Delgado, MSc Geological Engineer, EurGeol (Reg. 1234) Title: Qualified Person, Senior Water Resources Consultant


CONSENT
I, Manuel A. Hernández, a “qualified person” for purposes of Subpart 1300 of Regulation S-K as promulgated by the U.S. Securities and Exchange Commission (“S-K 1300”). In connection with Compañía de Minas Buenaventura S.A.A.’s (the “Company”) Annual Report on Form 20-F for the year ended December 31, 2021 and any amendments or supplements and/or exhibits thereto (collectively, the “Form 20-F”), consent to:
| ● | the public filing and use of the technical report summary titled “SEC Technical Report Summary Pre-Feasibility Study for El Brocal” (the “Technical Report Summary”), with an effective date of March 15, 2022, as an exhibit to and referenced in the Company’s Form 20-F; |
| ● | the use of and references to my name, including my status as an expert or “qualified person” (as defined in S-K 1300), in connection with the Form 20-F and any such Technical Report Summary; and |
| ● | the use of information derived, summarized, quoted or referenced from the Technical Report Summary, or portions thereof, that was prepared by me, that I supervised the preparation of and/or that was reviewed and approved by me, that is included or incorporated by reference in the Form 20-F. |
I am a qualified person responsible for authoring, and this consent pertains to, the following sections of the Technical Report Summary:
| ● | Section 1.3.11, 16 and 22.8 |

Signature of Authorized Person | |
Name: Manuel A. Hernández Fellow AusIMM - Member 306576 |
|


Rafael Santiago Luna, PE (Civil - California)
Golder Associates Peru S.A.
Av. La Paz 1049 Piso 7 Miraflores, Lima, Peru
CONSENT OF QUALIFIED PERSON
I, Rafael Santiago Luna, MSc, PE, state that I am responsible for preparing or supervising the preparation of
Section 15.2 of the technical report summary titled SEC Technical Report Summary Pre-Feasibility Study for El Brocal with an effective date of 15/03/2022 as signed and certified by me (the “Technical Report Summary”).
Furthermore, I state that:
(a) | I consent to the public filing of the Technical Report Summary by Compañía de Minas Buenaventura S.A.A.; |
(b) | the document that the Technical Report Summary supports is the Company’s 20-F of Buenaventura for fiscal year 2021 (the “Document”); |
(c) | I consent to the use of my name in the Document, to any quotation from or summarization in the Document of the parts of the Technical Report Summary for which I am responsible, and to the filing of the Technical Report Summary as an exhibit to the Document; and |
(d) | I confirm that I have read the Document, and that the Document fairly and accurately reflects, in the form and context in which it appears, the information in the parts of the Technical Report Summary for which I am responsible. |
Dated at Lima, Peru this 06 of May, 2022.
| | Professional Seal / Stamp |
| | |

Signature of Qualified Person
Rafael Santiago Luna, PE (Civil – California)
SRK Consulting Peru SA SEC Technical Report Summary – El Brocal | Page vii |
Table of Contents
1 | Executive Resume | 1 | ||
| 1.1 | Summary | 1 | |
| | 1.1.1 | Conclusions | 1 |
| | 1.1.2 | Recommendations | 4 |
| 1.2 | Economic Analysis | 5 | |
| 1.3 | Technical Summary | 5 | |
| | 1.3.1 | Property Description | 6 |
| | 1.3.2 | Land tenure | 6 |
| | 1.3.3 | History | 6 |
| | 1.3.4 | Geological and Mineralization | 6 |
| | 1.3.5 | Exploration Status | 7 |
| | 1.3.6 | Mineral Resources Estimates | 7 |
| | 1.3.7 | Mineral Reserve Estimates | 9 |
| | 1.3.8 | Mining Methods | 11 |
| | 1.3.9 | Mineral Processing | 11 |
| | 1.3.10 | Infrastructure | 12 |
| | 1.3.11 | Market Studies | 12 |
| | 1.3.12 | Environmental Studies, Permitting, and Plans, Negotiations, or Agreements with Local Individuals or Groups | 13 |
| | 1.3.13 | Capital and Operating Costs | 14 |
| | 1.3.14 | Economic Analysis | 15 |
2 | Introduction | 17 | ||
| 2.1 | Registrant for Whom the Technical Report Summary was Prepared | 17 | |
| 2.2 | Terms of Reference and Purpose of the Report | 17 | |
| 2.3 | Sources of Information | 17 | |
| 2.4 | Details of Inspection | 17 | |
| 2.5 | Report Version Update | 18 | |
3 | Property Description | 19 | ||
| 3.1 | Property Location | 19 | |
| 3.2 | Property Area | 19 | |
| 3.3 | Mineral Title, Claim, Mineral Right, Lease or Option Disclosure | 20 | |
| 3.4 | Mineral Rights Description and How They Were Obtained | 21 | |
| 3.5 | Encumbrances | 23 | |
| 3.6 | Other Significant Factors and Risk | 24 | |
| 3.7 | Royalties or Similar Interest | 24 | |
4 | Accessibility, Climate, Local Resources, Infrastructure and Physiography | 25 | ||
| May, 2022 |
SRK Consulting Peru SA SEC Technical Report Summary – El Brocal | Page viii |
| 4.1 | Topography, Elevation and Vegetation | 25 | |
| 4.2 | Means of Access | 25 | |
| 4.3 | Climate and Length of Operating Season | 25 | |
| 4.4 | Infrastructure Availability and Sources | 25 | |
| | 4.4.1 | Water | 25 |
| | 4.4.2 | Electricity | 26 |
| | 4.4.3 | Personnel | 26 |
| | 4.4.4 | Supplies | 27 |
5 | History | 28 | ||
6 | Geological Setting, Mineralization, and Deposit | 30 | ||
| 6.1 | Regional, Local and Property Geology | 30 | |
| 6.2 | Local Geology | 31 | |
| | 6.2.1 | Metamorphic rocks | 31 |
| | 6.2.2 | Sedimentary Rocks | 32 |
| | 6.2.3 | Volcanic Rocks | 33 |
| | 6.2.4 | Intrusive rocks | 33 |
| | 6.2.5 | Quaternary Deposits (Q) | 34 |
| | 6.2.6 | Structural Context | 35 |
| | 6.2.7 | Property Geology | 36 |
| | 6.2.8 | Structural Geology | 39 |
| 6.3 | Alteration | 41 | |
| 6.4 | Mineralization | 41 | |
| 6.5 | High sulfidation Au-(Ag) epithermal. | 41 | |
| | 6.5.1 | Cordilleran Epithermal | 41 |
| | 6.5.2 | Temporal evolution of mineralization at Colquijirca | 45 |
| 6.6 | Deposit Type | 48 | |
| 6.7 | Cordilleran Deposits | 48 | |
7 | Exploration | 51 | ||
| 7.1 | Exploration Work (Other Than Drilling) | 51 | |
| | 7.1.1 | Geological Mapping | 51 |
| | 7.1.2 | Geophysics | 51 |
| 7.2 | Significant Results and Interpretation | 53 | |
| 7.3 | Exploration Drilling | 53 | |
| | 7.3.1 | Drilling Surveys | 54 |
| | 7.3.2 | Sampling Methods and Sample Quality | 55 |
| | 7.3.3 | Downhole Surveying | 56 |
| | 7.3.4 | Geological Logging | 56 |
| | 7.3.5 | Diamond Drilling Sampling | 56 |
| | 7.3.6 | Drilling Type and Extent | 56 |
| | 7.3.7 | Drilling, Sampling, or Recovery Factors | 56 |
| May, 2022 |
SRK Consulting Peru SA SEC Technical Report Summary – El Brocal | Page ix |
8 | Sample Preparation, Analysis and Security | 57 | ||
| 8.1 | Sample Preparation Methods and Quality Control Measures | 57 | |
| | 8.1.1 | Sampling | 57 |
| | 8.1.2 | Sample Preparation | 57 |
| | 8.1.3 | Chain of Custody | 59 |
| 8.2 | Sample Preparation, Assaying and Analytical Procedures | 59 | |
| | 8.2.1 | Sample Analysis | 60 |
| 8.3 | Quality Control Procedures/Quality Assurance | 61 | |
| | 8.3.1 | Insertion Rate | 61 |
| | 8.3.2 | Evaluation of Control Samples | 61 |
| 8.4 | Opinion on Adequacy | 63 | |
| 8.5 | Non-Conventional Industry Practice | 63 | |
9 | Data Verification | 64 | ||
| 9.1 | Internal data validation | 64 | |
| 9.2 | External data validation | 64 | |
| 9.3 | Data Verification Procedures | 64 | |
| | 9.3.1 | Database Validation | 65 |
| | 9.3.2 | Assay Validation | 65 |
| 9.4 | Limitations | 66 | |
| 9.5 | Opinions and recommendations on database quality | 66 | |
10 | Mineral Processing and Metallurgical Testing | 67 | ||
| 10.1 | Ore Supply | 67 | |
| 10.2 | Sample Representativeness | 70 | |
| 10.3 | Plant 2, Lead and Zinc Ore | 74 | |
| 10.4 | Metallurgical Testing | 79 | |
| 10.5 | Conclusions and Recommendations | 82 | |
11 | Mineral Resources Estimates | 85 | ||
| 11.1 | Key Assumptions, Parameters, and Methods used | 85 | |
| 11.2 | Database | 85 | |
| 11.3 | Geological Model and Estimation Domains | 86 | |
| | 11.3.1 | Lithological and Structural Model | 86 |
| | 11.3.2 | Grade Shells and Domaining | 88 |
| 11.4 | Exploratory Data Analysis | 91 | |
| | 11.4.1 | Compositing and Capping | 91 |
| | 11.4.2 | Continuity Analysis: Variogram | 95 |
| 11.5 | Mineral Resources Estimates | 99 | |
| | 11.5.1 | Block Model | 99 |
| | 11.5.2 | Grade Interpolation and parameters | 99 |
| | 11.5.3 | Model Validation | 102 |
| | 11.5.4 | Bulk Density | 110 |
| May, 2022 |
SRK Consulting Peru SA SEC Technical Report Summary – El Brocal | Page x |
| | 11.5.5 | Mineral Resources Classification | 112 |
| | 11.5.6 | Reconciliation | 118 |
| | 11.5.7 | Cut-off grade estimates | 119 |
| | 11.5.8 | Reasonable Potential for Economic Extraction (RPEE) | 121 |
| | 11.5.9 | Uncertainty in the Mineral Resources Estimation | 125 |
| | 11.5.10 | Summary Mineral Resources | 125 |
| | 11.5.11 | Mineral Resources Sensitivity | 127 |
12 | Mineral Reserve Estimates | 129 | ||
| 12.1 | Open Pit Mineral Reserves | 129 | |
| | 12.1.1 | Introduction | 129 |
| | 12.1.2 | Key Assumptions, Parameters, and Methods Used | 129 |
| | 12.1.3 | Mining Dilution and Mining Recovery | 131 |
| | 12.1.4 | Cut Off Grades | 132 |
| 12.2 | Underground Mineral Reserves | 133 | |
| | 12.2.1 | Introduction | 133 |
| | 12.2.2 | Key Assumptions, Parameters, and Methods Used | 133 |
| | 12.2.3 | Mining Dilution and Mining Recovery | 135 |
| | 12.2.4 | Cut Off Grades | 136 |
| 12.3 | Metallurgical Recovery | 137 | |
| 12.4 | NSR Block value | 142 | |
| 12.5 | Material Risks Associated with the Modifying Factors | 143 | |
| 12.6 | Mineral Reserves Statement | 144 | |
13 | Mining Methods | 147 | ||
| 13.1 | Parameters Relevant to Mine Designs and Plans | 147 | |
| | 13.1.1 | Geotechnical | 150 |
| | 13.1.2 | Hydrogelogical | 172 |
| 13.2 | Production Rates, Expected Mine Life, Mining Unit Dimensions, and Mining Dilution and Recovery Factors | 175 | |
| | 13.2.1 | Open Pit | 175 |
| | 13.2.2 | Production schedule/phases | 175 |
| | 13.2.3 | Project life | 178 |
| | 13.2.4 | Mining unit dimensions (dimensions of benches and berms) | 178 |
| | 13.2.5 | Underground Mine | 180 |
| 13.3 | Requirements for Stripping, Underground Development, and Backfilling | 182 | |
| | 13.3.1 | Open Pit | 182 |
| | 13.3.2 | Underground | 193 |
| 13.4 | Required Mining Equipment Fleet and Machinery | 198 | |
| | 13.4.1 | Open pit mining equipment | 198 |
| | 13.4.2 | Underground mining equipment | 199 |
| 13.5 | Final Mine Outline Map | 199 | |
| May, 2022 |
SRK Consulting Peru SA SEC Technical Report Summary – El Brocal | Page xi |
| | 13.5.1 | General arrangement open pit and underground mining component | 199 |
| | 13.5.2 | Isometric and longitudinal plans | 201 |
14 | Recovery Methods | 202 | ||
| 14.1 | Plant 1 - Copper Ore | 202 | |
| | 14.1.1 | Ore Delivery | 202 |
| | 14.1.2 | Plant 1 – Crushing Stage | 203 |
| | 14.1.3 | Plant 1 – Grinding & Classification | 203 |
| | 14.1.4 | Plant 1 – Flotation & Regrinding | 203 |
| | 14.1.5 | Plant 1 – Concentrate Thickening & Filtration | 204 |
| | 14.1.6 | Plant 1 – Final Tails | 204 |
| | 14.1.7 | Plant 1, Operational Performance | 205 |
| 14.2 | Plant 2, Lead and Zinc Ore | 211 | |
| | 14.2.1 | Plant 2 – Crushing, Washing & Classification Stage | 213 |
| | 14.2.2 | Plant 2 – Grinding and Flotation, Coarse Fraction | 213 |
| | 14.2.3 | Plant 2 – Lead Concentrate Thickening & Filtration | 214 |
| | 14.2.4 | Plant 2 – Zinc Flotation Circuit | 214 |
| | 14.2.5 | Plant 2 – Zinc Concentrate Thickening & Filtration | 214 |
| | 14.2.6 | Plant 2 – Flotation, Fines Fraction | 214 |
| | 14.2.7 | Plant 2 – Flotation, Ultrafines Fraction | 215 |
| | 14.2.8 | Plant 2 – Operational Performance | 215 |
| 14.3 | Conclusions & Recommendations | 220 | |
15 | Infrastructure | 222 | ||
| 15.1 | Waste Rock Management Facility | 222 | |
| 15.2 | Tailings Management Facility | 223 | |
| | 15.2.1 | Huachuacaja tailings management facility and ancillary facilities | 223 |
| 15.3 | Mine Operations Support Facilities | 239 | |
| | 15.3.1 | Portal Access | 239 |
| | 15.3.2 | Underground Workshop | 239 |
| | 15.3.3 | Mine Administration Building | 239 |
| | 15.3.4 | Other facilities | 239 |
| 15.4 | Processing Plant Support Facilities | 239 | |
| | 15.4.1 | Laboratory | 239 |
| 15.5 | First-Aid Facility | 239 | |
| 15.6 | Man Camp | 240 | |
| 15.7 | Power Supply and Distribution | 240 | |
| 15.8 | Water Supply | 240 | |
| | 15.8.1 | Water Source | 240 |
| | 15.8.2 | Domestic Water Treatment Plant | 240 |
| 15.9 | Waste Water Treatment and Solid Water Disposal | 241 | |
| | 15.9.1 | Waste Water Treatment | 241 |
| May, 2022 |
SRK Consulting Peru SA SEC Technical Report Summary – El Brocal | Page xii |
| | 15.9.2 | Solid Waste Disposal | 241 |
16 | Market Studies | 242 | ||
| 16.1 | El Brocal markets | 242 | |
| | 16.1.1 | Copper market | 242 |
| | 16.1.2 | Zinc market | 247 |
| | 16.1.3 | Lead & silver markets | 252 |
| 16.2 | El Brocal products | 260 | |
| | 16.2.1 | Summary of El Brocal products | 260 |
| | 16.2.2 | Cu concentrate | 262 |
| | 16.2.3 | Zn concentrate | 263 |
| | 16.2.4 | Pb concentrate | 264 |
17 | Environmental Studies, Permitting, and Plans, Negotiations, or Agreements with Local Individuals or Groups | 266 | ||
| 17.1 | Environmental Study Results | 266 | |
| 17.2 | Project permitting requirements, the status of any permit applications, and any known requirements to post performance or reclamation bonds | 267 | |
| | 17.2.1 | Other permits required by other sectoral authorities. | 267 |
| | 17.2.2 | Mining operating permits issued by sectoral mining authorities. | 268 |
| 17.3 | Mine closure plans, including remediation and reclamation plans, and associated costs | 269 | |
| 17.4 | Social relations, commitments, and agreements with individuals and local groups. | 269 | |
| 17.5 | Mine Reclamation and Closure | 270 | |
| | 17.5.1 | Closure Planning | 270 |
| | 17.5.2 | Closure Cost Estimate | 272 |
| | 17.5.3 | Limitations on the Current Closure Plan and Cost Estimate | 274 |
| | 17.5.4 | Material Omissions from the Closure Plan and Cost Estimate | 274 |
| 17.6 | Adequacy of Plans | 276 | |
| | 17.6.1 | Environmental | 276 |
| | 17.6.2 | Local Individuals and Groups | 277 |
| | 17.6.3 | Mine Closure | 277 |
| 17.7 | Commitments to Ensure Local Procurement and Hiring | 279 | |
| | 17.7.1 | Commitments to ensure the hiring of local labor | 279 |
| | 17.7.2 | Commitments to ensure local procurement | 279 |
18 | Capital and Operating Costs | 281 | ||
| 18.1 | Capital and Operating Cost Estimates | 281 | |
| | 18.1.1 | Operating Costs | 281 |
| | 18.1.2 | Capital Costs | 282 |
| | 18.1.3 | Closure Cost | 282 |
| 18.2 | Basis and Accuracy Level for Cost Estimates | 284 | |
| | 18.2.1 | Basis and Premises for operating cost | 284 |
| | 18.2.2 | Basis and Premises for capital cost | 285 |
| May, 2022 |
SRK Consulting Peru SA SEC Technical Report Summary – El Brocal | Page xiii |
19 | Economic Analysis | 286 | ||
| 19.1 | General Description | 286 | |
| | 19.1.1 | Financial Model Parameters | 286 |
| | 19.1.2 | External Factors | 286 |
| | 19.1.3 | Technical Factors | 288 |
| 19.2 | Results | 291 | |
| 19.3 | Sensitivity Analysis | 293 | |
20 | Adjacent Properties | 294 | ||
21 | Other Relevant Data and Information | 295 | ||
22 | Interpretation and Conclusions | 296 | ||
| 22.1 | Geology & Exploration | 296 | |
| 22.2 | QA/QC & Data verification | 296 | |
| 22.3 | Mineral processing | 297 | |
| 22.4 | Mineral Resource estimates | 297 | |
| 22.5 | Mining methods | 298 | |
| 22.6 | Recovery methods | 298 | |
| 22.7 | Infrastructure | 299 | |
| 22.8 | Market studies | 300 | |
| 22.9 | Environmental studies & Permitting | 300 | |
23 | Recommendations | 302 | ||
| 23.1 | Geological Setting, mineralization and Deposit | 302 | |
| 23.2 | Mineral Resources | 302 | |
| 23.3 | Sample Preparation, Analysis and Security | 302 | |
| 23.4 | Data Verification | 302 | |
| 23.5 | Mining and Mineral Reserves | 302 | |
| 23.6 | Environmental, Permitting, and Social Considerations | 303 | |
| 23.7 | Capital and Operating Costs | 303 | |
24 | References | 304 | ||
25 | Reliance on Information Provided by the Registrant | 305 | ||
| 25.1 | Introduction | 305 | |
| 25.2 | Macroeconomic Trends | 305 | |
| 25.3 | Markets | 305 | |
| 25.4 | Legal Matters | 305 | |
| 25.5 | Environmental Matters | 305 | |
| 25.6 | Stakeholder Accommodations | 306 | |
| 25.7 | Governmental Factors | 306 | |
| May, 2022 |
SRK Consulting Peru SA SEC Technical Report Summary – El Brocal | Page xiv |
List of Tables
Table 1-1: Summary of Mineral Resources | 7 |
Table 1-2: El Brocal Underground Summary Mineral Reserve Statement as of December 31st, 2021 | 9 |
Table 1-3: El Brocal Open Pit Summary Mineral Reserve Statement as of December 31st, 2021 | 10 |
Table 1-4: Summary estimates cost | 14 |
Table 1-5: Summary of total closure costs | 15 |
Table 1-6: Indicative Economic Results | 16 |
Table 2-1: Site Visits | 18 |
Table 3-1: Information on the concessions of El Brocal mining property. | 21 |
Table 4-1: Electrical Energy Source | 26 |
Table 4-2: Direct employees classified by type of hiring and gender | 26 |
Table 4-3: Direct employees classified by type of professional category | 26 |
Table 7-1: Table DDH campaigns in El Brocal | 54 |
Table 8-1: Distribution of samples analyzed according to the laboratory and sampling period | 59 |
Table 8-2: Analytical methods used at El Brocal Internal Laboratory | 60 |
Table 8-3: Analytical methods used at CERTIMIN External Laboratory | 60 |
Table 8-4: El Brocal Control Sample Insertion Rate. | 61 |
Table 8-5: Observations found in the QC analysis. | 62 |
Table 9-1: Summary of drilling information provided by Buenaventura. | 65 |
Table 9-2: Database validation summary | 65 |
Table 9-3: Observations found in the Assay Cross Validation | 65 |
Table 10-1: El Brocal, Mill Feed Sourcing, 2017 to 2020 November Period | 67 |
Table 10-2-: El Brocal, Mill Feed Composition by Period | 68 |
Table 10-3: Operating Time and Throughput | 71 |
Table 10-4: Plant 1´s Overall Performance | 71 |
Table 10-5: Plant 2, Operating time and Throughput | 76 |
Table 10-6: Plant 2´s Overall Performance | 77 |
Table 11-1: Statistics of the El Brocal Original Data | 85 |
Table 11-2: El Brocal domains used in the estimation. | 89 |
Table 11-3: Statistics of Zinc Grade Shell Model Indicators | 90 |
Table 11-4: Cu, Pb and Zn Capping Values Applied in El Brocal. | 92 |
Table 11-5: Statical comparison before and after capping of Pb in domain 32 (Capping: 4.5%) | 93 |
Table 11-6: Statistical comparison between uncomposited data and composited data for copper (%) in domain 3. | 94 |
Table 11-7: Summary of statistics composited data in main domains for copper, zinc and lead. | 94 |
Table 11-8: Summary of Cu, Pb and Zn Variogram Model Parameters | 98 |
Table 11-9: Brocal Block Model detail. | 99 |
Table 11-10: Cu, Pb and Zn Estimation Parameters | 100 |
Table 11-11: Verification of the Global Bias in Cu Domains of El Brocal Mine | 104 |
| May, 2022 |
SRK Consulting Peru SA SEC Technical Report Summary – El Brocal | Page xv |
Table 11-12: Verification of the Global Bias in El Brocal Pb Domains | 105 |
Table 11-13: Verification of the Global Bias in El Brocal Zn Domains | 105 |
Table 11-14: El Brocal density measurement after statistical evaluation. | 111 |
Table 11-15: Summary of aspect to be evaluated in confident limit analysis | 113 |
Table 11-16: Calculation of A90% and Q90% based for each drilling mesh for Zinc zone | 113 |
Table 11-17: Calculation of A90% and Q90% based for each drilling mesh for Zinc zone | 113 |
Table 11-18: Risk Associated to the Information and Estimation Results | 116 |
Table 11-19: Summary of Values that will be Used in the Classification | 117 |
Table 11-20: Reconciliation for 2020 and 2021 Periods | 119 |
Table 11-21: Cost structure for El Brocal resources (open pit) | 120 |
Table 11-22: Cost structure for El Brocal resources (underground) | 121 |
Table 11-23: Parameters used for RPEE evaluation. | 122 |
Table 11-24: Metallurgical recoveries functions for El Brocal | 122 |
Table 11-25: Cut-Off differentiated by Mining Method | 124 |
Table 11-26: Zn-Pb Mineral Resources Statement, Open Pit, El Brocal Mine, Department of Pasco - Peru, December 31, 2021. | 126 |
Table 11-27: Cu Mineral Resources Statement, Open Pit, El Brocal Mine, Departament of Pasco - Peru, December 31, 2021. | 126 |
Table 11-28: Cu Mineral Resources Statement, Underground Mine, El Brocal, Department of Pasco - Peru, December 31, 2021. | 126 |
Table 12-1: Lerchs & Grossmann Optimization Parameters | 129 |
Table 12-2: OP in-situ dilution values | 131 |
Table 12-3: OP NSR cut-off Input parameters | 133 |
Table 12-4: OP NSR cut-off value | 133 |
Table 12-5: Underground in-situ dilution values | 135 |
Table 12-6: NSR cut-off Input parameters for underground operations | 136 |
Table 12-7: NSR cut-off value for underground operations | 136 |
Table 12-8: El Brocal processing plants and products | 137 |
Table 12-9: Metallurgical recovery functions - Copper Concentrate | 138 |
Table 12-10: Metallurgical recovery functions - Lead Concentrate | 140 |
Table 12-11: Metallurgical recovery functions - Zinc Concentrate | 141 |
Table 12-12: Metal Prices for mineral reserves definition | 143 |
Table 12-13: Estimated unit value by metal and type of concentrate | 143 |
Table 12-14: El Brocal Underground Summary Mineral Reserve Statement as of December 31st, 2021 | 145 |
Table 12-15: El Brocal Open Pit Summary Mineral Reserve Statement as of December 31st, 2021 | 146 |
Table 13-1: El Brocal Cu-Ag ore reserves report | 149 |
Table 13-2: El Brocal Pb-Zn ore reserves report | 150 |
Table 13-3: Summary of soft material properties | 152 |
Table 13-4: Summary of rock mass properties | 153 |
Table 13-5: Mining methods by sector | 160 |
| May, 2022 |
SRK Consulting Peru SA SEC Technical Report Summary – El Brocal | Page xvi |
Table 13-6: RMR’76 statistics by geotechnical sectors. | 161 |
Table 13-7: Dimension of stopes for ELOS=0.5 m and RMR > 60 (II) | 166 |
Table 13-8: Dimension of stopes for ELOS=0.5 m and RMR 50-60 (IIIa) | 167 |
Table 13-9: Maximum span (m) for stopes dome | 167 |
Table 13-10: Dimension of stopes for ELOS=0.5 m, RMR > 60 (II) | 170 |
Table 13-11: Dimension of stopes for an ELOS=0.5 m, RMR 50 to 60 (IIIa) | 170 |
Table 13-12: Dimension of stopes for an ELOS=0.5 m, RMR 40 to 50 (IIIb) | 170 |
Table 13-13: Dimension of stopes for an ELOS=0.5 m, RMR 30 to 40 (IVa) | 171 |
Table 13-14: Cemented backfill strength required for underground mining | 172 |
Table 13-15: Tajo Sur (Cu-Ag ore) open pit mining plan | 176 |
Table 13-16: Tajo Norte & Tajo Sur (Pb-Zn ore) open pit mining plan | 177 |
Table 13-17: Insitu dilution values | 179 |
Table 13-18: Marcapunta (Cu-Ag ore) underground mining plan | 181 |
Table 13-19: Stripping ratio report by phase | 184 |
Table 13-20: Characteristic of the triangular section gutter | 185 |
Table 13-21: Details the characteristics of the section | 187 |
Table 13-22: Characteristics of the pumping equipment in the open pit | 191 |
Table 13-23: San Martin contractor company’s equipments | 198 |
Table 13-24: Smelter contractor company’s equipments | 198 |
Table 13-25: Ecosarc contractor company' equipments | 198 |
Table 13-26: Underground mining equipment | 199 |
Table 14-1: Plant 1 – Copper Ore 2017 – 2020 Monthly Production Results | 206 |
Table 14-2: Plant 1, Throughput Variability as Function of Grinding P80 | 208 |
Table 14-3: El Brocal, Plant 2 – Overall Operational Results 2017 – 2020 | 216 |
Table 14-4: Plant 2, Throughput Variability v/s Grinding P80 | 217 |
Table 15-1: Summary of Geotechnical Investigation | 229 |
Table 15-2: Huachuacaja Tailings Management Facility Heightening Schedule. | 231 |
Table 15-3: Results of Physical Stability Analyses of the Huachuacaja Tailings Dam. | 234 |
Table 15-4: Specifications for Placement and Compaction of Dam Materials | 236 |
Table 15-5: Geotechnical Instrumentation Monitoring Frequency. | 238 |
Table 16-1: Copper LME cash prices 2021 – 2036 (US$/t) | 247 |
Table 16-2: Zinc LME cash prices 2021 – 2036 (US$/t) | 252 |
Table 16-3: Lead LME cash prices 2021 – 2036, US$/t | 257 |
Table 16-4: Silver prices 2021 - 2036, US$/oz | 260 |
Table 16-5: Typical specifications of El Brocal’s concentrates | 261 |
Table 17-1: UM El Brocal closure cost comparison | 273 |
Table 17-2: post-closure approved closure plan and update (2021) | 273 |
Table 17-3: Water Treatment Capex | 276 |
Table 17-4: Total Water Treatment Costs Annual Summary | 276 |
Table 18-1: Operating cost estimate | 281 |
| May, 2022 |
SRK Consulting Peru SA SEC Technical Report Summary – El Brocal | Page xvii |
Table 18-2: Capital cost estimation | 282 |
Table 18-3: Closure Cost | 283 |
Table 18-4: Operational parameters | 285 |
Table 19-1: Financial Model Parameters | 286 |
Table 19-2: Metal Prices forecast | 287 |
Table 19-3: El Brocal Mining Summary | 288 |
Table 19-4: Reference unit cost for Yearly cost calculation | 289 |
Table 19-5: Yearly material movement (tonnage) | 290 |
Table 19-6: Yearly incremental (Bench) cost - Ore & Waste | 290 |
Table 19-7: Yearly Cost (No contingency) | 290 |
Table 19-8: Yearly cost (Including contingency 10%) | 290 |
Table 19-9: Summary of Corporate Costs | 291 |
Table 19-10: Yearly capital costs | 291 |
Table 19-11: Indicative Economic Results | 291 |
Table 19-12: Cashflow Analysis on an Annualized Basis | 292 |
| May, 2022 |
SRK Consulting Peru SA SEC Technical Report Summary – El Brocal | Page xviii |
List of Figures
Figure 3-1 Location map of El Brocal mine, which comprises the deposits of Colquijirca, Marcapunta, and San Gregorio. | 19 |
Figure 3-2: Map of El Brocal mining operations and concentrator plant. | 20 |
Figure 3-3: El Brocal mining claims | 21 |
Figure 6-1: Geology and main mining centers in the Cerro de Pasco sector, central Andes of Peru. | 30 |
Figure 6-2: Magmatic arcs of the Cerro de Pasco (22-k) quadrangle. | 31 |
Figure 6-3: Geologic map of the Colquijirca Mining District, showing the sectors: Tajo Norte, Tajo Sur and Marcapunta. | 35 |
Figure 6-4: Geologic map of the diatreme-dome complex at Cerro de Pasco | 37 |
Figure 6-5: The geologic and lithostratigraphic map of Tajo Colquijirca. | 38 |
Figure 6-6: Geologic and structural map of North Pit - Marcapunta. | 40 |
Figure 6-7: Alunite samples from the Colquijirca zone. | 42 |
Figure 6-8: Block diagram illustrating the spatial relationships between the Oro Marcapunta high sulfidation epithermal Au-(Ag) mineralization and the Marcapunta Oeste, Smelter and Colquijirca Cordilleran base metal deposits | 43 |
Figure 6-9: Mineralogy of Colquijirca deposit. | 45 |
Figure 6-10: Paragenetic sequence for the first stage of mineralization (including observations by Bowditch 1935, Lacy 1949, and Einaudi 1968, 1977). | 46 |
Figure 6-11: Paragenetic sequence of Cordilleran base metal replacement ore bodies. | 47 |
Figure 6-12: Paragenetic sequence of second-stage veins hosted in the diatreme breccia. | 48 |
Figure 6-13: Schematic cross section of the Colquijirca district showing the spatial and temporal distribution of the different deposit types | 49 |
Figure 7-1: Image of the Marcapunta topography | 52 |
Figure 7-2: Image of the residual complete Bouguer gravity for the Marcapunta Project. | 53 |
Figure 7-3: Property Drill Collar Location (2018, 2019, 2020 and 2021 campaigns) | 55 |
Figure 8-1: Sample Preparation Diagram | 58 |
Figure 10-1: El Brocal, Fresh Ore Destination and Final Products | 67 |
Figure 10-2: Marcapunta Ore Production | 69 |
Figure 10-3: Marcapunta Ore Allocation to Plant 1 and Plant 2 | 69 |
Figure 10-4: Tajo Norte Ore Production | 70 |
Figure 10-5: Simplified Block Flow Diagram, Plant 1 | 71 |
Figure 10-6: Plant 1’s Overall Performance | 73 |
Figure 10-7: Plant 1 – Daily Performance – Throughput and Grinding P80 | 74 |
Figure 10-8: Plant 1, Throughput versus Grinding P80 | 74 |
Figure 10-9: Simplified Block Flow Diagram, Plant 2 | 75 |
Figure 10-10: Plant 2´s Overall Performance | 78 |
Figure 10-11: Plant 2 – Daily Performance – Throughput and Grinding P80 | 78 |
Figure 10-12: Plant 1, Throughput versus Grinding P80 | 79 |
Figure 10-13: Metallurgical Testing 2021, Sample´s Location | 79 |
Figure 10-14: Marcapunta, 2021 Composite’s Mineral Composition | 80 |
Figure 10-15: Marcapunta, 2021 Composite´s Overall Mineral Composition | 80 |
| May, 2022 |
SRK Consulting Peru SA SEC Technical Report Summary – El Brocal | Page xix |
Figure 10-16: Marcapunta, 2021 Composite’s Mineral Composition | 81 |
Figure 10-17: Tajo Norte Mineralogical Composition | 82 |
Figure 10-18: Tajo Norte, 2021 Composite’s Overall Mineral Composition | 82 |
Figure 11-1: 3D View of El Brocal Lithological Model | 87 |
Figure 11-2: 3D View of El Brocal Modeled Structures | 88 |
Figure 11-3: 3D View of medium-grade envelop (yellow) and High-grade (red) within the “Calera Medio Favorable” Unit (Cal_Mid_Fav). | 90 |
Figure 11-4: Cross Section of the Zinc Grade Envelop in domain cal_mid_fav | 90 |
Figure 11-5: Top-Cut analysis of Pb in domain 32. | 93 |
Figure 11-6: Cu Modeled Variogram within Domain 62/63. | 95 |
Figure 11-7: Zn Modeled Variogram within Domain 32/33. | 96 |
Figure 11-8: Pb Modeled Variogram within Domain 52/53. | 96 |
Figure 11-9: Cross Validation for Domain 42, 43 for Zinc. | 102 |
Figure 11-10: Visual Validation of the Cu (%) Grade Model Versus the Grade in the Drillholes | 103 |
Figure 11-11: Visual Validation of the Pb (%) Grade Model Versus the Grade in the Drillholes | 103 |
Figure 11-12: Visual Validation of the Zn (%) Grade Model Versus the Grade in the Drillholes | 104 |
Figure 11-13: Swath Plots Comparing Estimation of Cu OK Versus Cu NN in the Three Dimensions, in the Domain 62. | 107 |
Figure 11-14: Swath Plots Comparing Estimation of Pb OK Versus Pb NN in the Three Directions, in the Domain 32. | 108 |
Figure 11-15: Swath Plots Comparing Estimation of Zn OK Versus Zn NN in the Three Directions, in Domain 52. | 109 |
Figure 11-16: Influence limit to classify the El Brocal resources | 112 |
Figure 11-17: Plot of space vs error for Zn zone | 114 |
Figure 11-18: Plot of space vs error for Cu zone | 114 |
Figure 11-19: Limits about the QAQC risk based in performance of results | 115 |
Figure 11-20: Limits about the structural model risk based in confidence information and results | 116 |
Figure 11-21: Resources Classification process | 118 |
Figure 11-22: Schematic graph of Room and Pillar with long holes and Sub Level Stopping. | 125 |
Figure 11-23: Grade-Tonnage Curve for measured and indicated Mineral Resources for Open Pit (Zinc Zone). | 128 |
Figure 11-24: Grade-Tonnage Curve for measured and indicated Mineral Resources for Open Pit (Copper Zone). | 128 |
Figure 11-25: Grade-Tonnage Curve for measured and indicated Mineral Resources for Underground. | 128 |
Figure 12-1: Design recommendations for open pit design 2020 | 130 |
Figure 12-2: Ore envelope and dilution application criterion | 132 |
Figure 12-3: Cu recovery in Copper Concentrate | 138 |
Figure 12-4: Ag recovery in Copper Concentrate | 139 |
Figure 12-5: Au recovery in Copper Concentrate | 139 |
Figure 12-6: Pb recovery in Lead Concentrate | 140 |
Figure 12-7: Ag recovery in Lead Concentrate | 141 |
| May, 2022 |
SRK Consulting Peru SA SEC Technical Report Summary – El Brocal | Page xx |
Figure 12-8: Zn recovery in Zinc Concentrate (Fe <= 9.6%) | 142 |
Figure 12-9: Ag recovery in Zinc Concentrate | 142 |
Figure 13-1: El Brocal deposit mineralization zoning | 147 |
Figure 13-2: Distribution of El Brocal mining operations | 148 |
Figure 13-3: Underground mining scheme in El Brocal | 149 |
Figure 13-4: Lithological model 2021 projected in the design of the El Brocal open pit. | 151 |
Figure 13-5: Nonlinear failure envelope for backfill material | 152 |
Figure 13-6: Main faults in the El Brocal structural model | 153 |
Figure 13-7: Definition of structural domains in the El Brocal pit | 154 |
Figure 13-8: Design sectors for stability analysis of El Brocal pit | 155 |
Figure 13-9: Example of stability analysis. Section S2 for the sector of the same name | 155 |
Figure 13-10: Design recommendations for open pit design 2020 | 156 |
Figure 13-11: Simulation of open pit mining to identify critical sectors | 158 |
Figure 13-12: Section 6 - maximum shear isocontours under static conditions | 158 |
Figure 13-13: Projected 2020 reserves with open pit design | 159 |
Figure 13-14: East view of 2020 reserves with open pit projection | 159 |
Figure 13-15: Geotechnical analysis sectors | 161 |
Figure 13-16: Structural domains defined for the El Brocal mine | 162 |
Figure 13-17: Major faults in the underground mine | 163 |
Figure -13-18: Plan view of El Brocal mine’s current mining area | 164 |
Figure 13-19: Rib pillar stresses vs. rock type failure criteria | 165 |
Figure 13-20: Stability retro-analysis of El Brocal south area mining stopes | 165 |
Figure 13-21: Typical support section in the long-hole room and pillar method | 168 |
Figure 13-22: Profile view looking north of the north mining sector. | 169 |
Figure 13-23: Typical mining section for rib pillar recovery with cemented backfill. | 169 |
Figure 13-24: Typical support section in the dome of primary and secondary stopes | 171 |
Figure 13-25: Annual average estimates of pit and underground inflow | 173 |
Figure 13-26: Proposed pit dewatering sector | 174 |
Figure 13-27: Design parameters (bench, berm, y ramp) | 178 |
Figure 13-28: Optimum turning radius | 178 |
Figure 13-29: Loading wide area | 179 |
Figure 13-30: Ore envelope and dilution application criterion. | 180 |
Figure 13-31: Sequence of mining phases | 183 |
Figure 13-32: Detail of triangular gutter design | 185 |
Figure 13-33: Location from the gutters with priority in the haul roads | 186 |
Figure 13-34: Section typical on sidewalks | 187 |
Figure 13-35: Detail of trapezoidal gutter design | 187 |
Figure 13-36: Gutters coated with geomembrane on the north side of the open pit | 188 |
Figure 13-37: Location of the gutters on Condorcayan dump | 188 |
Figure 13-38: View the waterproofing gutter on the perimeter of the South dump | 189 |
| May, 2022 |
SRK Consulting Peru SA SEC Technical Report Summary – El Brocal | Page xxi |
Figure 13-39: Location of the perimetral and crowning gutter of the South dump | 190 |
Figure 13-40: Location of drainage wells on the open pit | 191 |
Figure 13-41: “El Metropolitano” water storage and pumping station, level 4294 | 192 |
Figure 13-42: Poza on the bottom of the open pit, temporarily located at level 4150 | 192 |
Figure 13-43: "Poza la Llave" pumping station, located at level 4250 | 193 |
Figure 13-44: 3D view of the scheme of sublevel stoping mining method with continuous pillars | 195 |
Figure 13-45: Plan view of the scheme of sublevel stoping mining method with continuous pillars | 195 |
Figure 13-46: Profile view of the scheme of sublevel stoping mining method with continuous pillars. | 196 |
Figure 13-47: Profile view of the scheme of sublevel stoping mining method with continuous pillars, leaving a bridge pillar in the areas where it has been mined with chambers and pillars in the upper part. | 196 |
Figure 13-48: Profile view of the scheme of the sublevel stoping mining method with continuous pillars, leaving shield pillars so as not to affect the main extraction access galleries. | 197 |
Figure 13-49: Profile view of the scheme detrital fill | 197 |
Figure 13-50: Disposition of the main components of open pit and underground mining operations | 200 |
Figure 13-51: Longitudinal view of open pit and underground mining operations | 201 |
Figure 14-1: El Brocal, Fresh Ore Destination and Final Products | 202 |
Figure 14-2: Simplified Block Flow Diagram, Plant 1 | 204 |
Figure 14-3: El Brocal, Plant 1 Flowsheet | 205 |
Figure 14-4: Plant 1, Ore Throughput v/s Grinding P80 | 209 |
Figure 14-5: Plant 1, Ore Throughput and Grinding P80 v/s time | 209 |
Figure 14-6: Recovery to Concentrate v/s Ore Throughput, Monthly and Daily Basis | 210 |
Figure 14-7: Head Grade Variability 2018 to 2020 | 210 |
Figure 14-8: Concentrate 1 Production versus Copper Head Grade | 211 |
Figure 14-9: El Brocal, Plant 2 Simplified Block Flow Diagram | 212 |
Figure 14-10: El Brocal, Plant 2 Detailed Flowsheet | 212 |
Figure 14-11: Plant 2, Ore Throughput v/s Grinding P80 | 217 |
Figure 14-12: Plant 2, Grinding P80 Frequency Distribution | 218 |
Figure 14-13: Plant 2, Ore Throughput & Grinding P80 v/s Time | 218 |
Figure 14-14: Plant 2, Key Metallurgical Relationships | 219 |
Figure 14-15: Plant 2, Recovery v/s P80 | 219 |
Figure 14-16: Plant 2, Concentrates Grade v/s P80 | 220 |
Figure 15-1: Condorcayan waste Dump | 223 |
Figure 16-1: Copper demand by end-use product and sector | 242 |
Figure 16-2: Copper value chain | 243 |
Figure 16-3: Simplified Copper value chain | 244 |
Figure 16-4: Copper supply-demand gap analysis, 2021 - 2036, kt | 245 |
Figure 16-5: Copper Market Balance 2021 – 2026 (kt) | 246 |
Figure 16-6: LME Copper cash prices, 2021-2036 (US$/t) | 247 |
Figure 16-7: Global zinc demand by first-use sector and end-use sector | 248 |
Figure 16-8: Zinc value chain | 248 |
| May, 2022 |
SRK Consulting Peru SA SEC Technical Report Summary – El Brocal | Page xxii |
Figure 16-9: Simplified zinc value chain | 249 |
Figure 16-10: Zinc supply-demand gap analysis, 2021 - 2036, k | 251 |
Figure 16-11: Zinc Market Balance 2021 – 2026 (kt) | 251 |
Figure 16-12: LME zinc cash prices, 2021-2036 (US$/t) | 252 |
Figure 16-13: Lead demand by end-use sector | 253 |
Figure 16-14: Lead industrial value chain | 253 |
Figure 16-15: Simplified lead value chain | 254 |
Figure 16-16: Lead supply-demand gap analysis, 2021 - 2036, kt | 256 |
Figure 16-17: Lead Market Balance 2021 – 2026 (kt) | 256 |
Figure 16-18: LME cash lead prices 2021 – 2036, US$/t | 257 |
Figure 16-19: Silver demand b end-use | 257 |
Figure 16-20: Silver value chain | 258 |
Figure 16-21: Silver supply-demand gap analysis, 2021 - 2036, kt | 259 |
Figure 16-22: Silver Market Balance 2021 – 2026 (kt) | 259 |
Figure 16-23: Silver price forecast, 2015 – 2036, US$/oz | 260 |
Figure 16-24: Figure Sample boxplot | 261 |
Figure 16-25: Copper concentrate of El Brocal mine | 262 |
Figure 16-26: Zn concentrate of El Brocal mine | 263 |
Figure 16-27: Pb concentrate of El Brocal mine | 265 |
Figure 19-1: El Brocal Mining profile graphic | 288 |
Figure 19-2: El Brocal Processing profile graphic | 289 |
Figure 19-3: El Brocal NPV Sensitivity Analysis | 293 |
APPENDICES
Appendix A: EDA
Appendix B: Compound EDA
Appendix C: Top cut
Appendix D: Envelopes
Appendix E: Variography
Appendix F: Estimation Parameters
Appendix G: Overall Bias
| May, 2022 |
SRK Consulting Peru SA SEC Technical Report Summary – El Brocal | Page xxiii |
Abbreviations
[Metric]
The metric system has been used throughout this report. Tonnes are metric of 1,000 kg, or 2,204.6 lb. All currency is in U.S. dollars (US$) unless otherwise stated.
[US System]
The US System for weights and units has been used throughout this report. Tonnes are reported in short tonnes of 2,000lbs. All currency is in U.S. dollars (US$) unless otherwise stated.
To facilitate the reading of large numbers, commas are used to group the figures three by three starting from the comma or decimal point.
Abbreviation | Unit or Term |
% | Percent |
° | Degree (degrees) |
°C | Degrees Centigrade |
µm | Micron or microns |
A | Ampere |
A/m² | Amperes per square meter |
AA | Atomic absorption |
AASP | Atomic Absorption Spectroscopy -Perchloric digestion Perchloric digestion |
ABA | Acid-base Accounting |
acQuire | Systematic database program |
ADI | Area of direct influence |
Ag | Silver |
ANA | National water authority |
ANFO | Ammonium nitrate fuel oil |
Au | Gold |
AuEq | Gold equivalent grade |
Buenaventura | Cía de Minas Buenaventura S.A.A. |
BVN | Cía de Minas Buenaventura S.A.A. |
CCD | Counter-current decantation |
cfm | Cubic feet per minute |
CFW | Close footwall |
CHW | Close hanging wall |
CIL | Carbon-in-leach |
CIRA | A certificate of non-existence of archeological remains |
cm | Centimeter |
cm² | Square centimeter |
cm³ | Cubic centimeter |
| May, 2022 |
SRK Consulting Peru SA SEC Technical Report Summary – El Brocal | Page xxiv |
CoG | Cut-off grade |
ConfC | Confidence code |
CRec | Core recovery |
CSS | Closed-side setting |
CTW | Calculated true width |
Cu | Copper |
DCR | Design change request |
DDH | Diamond drill holes |
dia. | Diameter |
EDA | Exploratory Data Analysis |
EIAd | Estudio de Impacto. Ambiental detallado |
EIS | Environmental impact statement |
El Brocal | Sociedad Minera El Brocal S.A.A. |
ELOS | Equivalent linear overbreak/slough |
EMP | Environmental management plan |
FA | Fire assay |
FAAAS | Fire Assay - Atomic Absorption Spectroscopy finish |
FCF | Free Cash Flow |
FI | Field instructions |
FOS | Factor of Safety |
ft | Foot (feet) |
ft2 | Square foot (feet) |
ft3 | Cubic foot (feet) |
FW | Footwall |
g | Gram |
g/L | Gram per liter |
g/t | Grams per tonne |
gal | Gallon |
g-mol | Gram-mole |
gpm | Gallons per minute |
GSI | Geological strength index |
GWI | Ground water international |
ha | Hectares |
HDPE | Height density polyethylene |
hp | Horsepower |
HTC | Humidity cell leaching |
HTW | Horizontal true width |
HVACR | Heating,ventilation, air conditioning & refrigeration |
HW | Hanging wall |
ICP | Induced couple plasma |
ID2 | Inverse-distance squared |
ID3 | Inverse-distance cubed |
| May, 2022 |
SRK Consulting Peru SA SEC Technical Report Summary – El Brocal | Page xxv |
IFC | International finance corporation |
ILS | Intermediate leach solution |
Ingemmet | Institute of Geology, Mining and Metallurgy |
IRA | Inter-ramp angles |
IW | Intermediate wall |
kA | Kiloamperes |
kg | Kilograms |
km | Kilometer |
km² | Square kilometer |
koz | Thousand troy ounce |
kt | Thousand tonnes |
kt/d | Thousand tonnes per day |
kt/y | Thousand tonnes per year |
kV | Kilovolt |
kW | Kilowatt |
kWh | Kilowatt-hour |
kWh/t | Kilowatt-hour per metric tonne |
L | Liter |
L/sec | Liters per second |
L/sec/m | Liters per second per meter |
lb | Pound |
LHD | Long-Haul Dump truck |
LIMS | Laboratory information management system |
LLDDP | Linear low density polyethylene plastic |
LME | London metal exchange |
LOI | Loss on ignition |
LOM | Life of the mine |
m | Meter |
m.y. | Million years |
m² | Square meter |
m³ | Cubic meter |
MARN | Ministry of the Environment and Natural Resources |
MASL | Meters above sea level |
MCE | Maximum credible earthquake |
MCP | Mine closure plan |
MDA | Mine development associates |
mg/L | Milligrams/liter |
MINAM | Ministry of Environment |
MINEM | Ministry of Energy and Mines |
MJ | Megajoules |
mm | Millimeter |
mm² | Square millimeter |
| May, 2022 |
SRK Consulting Peru SA SEC Technical Report Summary – El Brocal | Page xxvi |
mm³ | Cubic millimeter |
MME | Mine & mill engineering |
Moz | Million troy ounces |
Mt | Million tonnes |
MTW | Measured true width |
MW | Million watts |
NCR | Non - conformities |
NGO | Non-governmental organization |
NI 43-101 | Canadian National Instrument 43-101 |
NSR | Net Smelter Return |
NYSE | New York Stock Exchange |
OEFA | Environmental Evaluation and Oversight Agency |
OP | Open pit |
ORE | Orebody |
OSC | Ontario securities commission |
Osinergmin | Supervisory Agency for Investment in Energy and Mining |
oz | Troy ounce |
PAMA | Environmental Adjustment and Management Program |
Pb | Lead |
PLC | Programmable logic controller |
PLS | Pregnant leach solution |
PMF | Probable maximum flood |
ppb | Parts per billion |
ppm | Parts per million |
PTARD | Domestic wastewater treatment plants |
Q | Quaternary deposits |
QA/QC | Quality assurance/quality control |
Q-al | Alluvial deposits |
Q-bo | Wetland deposits |
Q-co | Colluvial deposits |
Q-fg | Fluvio-glacial Deposits |
Q-g | Glacial deposits |
R&P | Room & pillar |
RC | Rotary circulation drilling |
RCs | Refining costs |
RDC | Ruta de Cobre |
RFI | Request for information |
RMR | Rock mass rating |
RoM | Run-of-Mine |
RQD | Rock quality description |
SEC | U.S. securities & exchange commission |
sec | Second |
| May, 2022 |
SRK Consulting Peru SA SEC Technical Report Summary – El Brocal | Page xxvii |
SENACE | National environmental certification authority |
SFE | Short-term leaching by shake flask extraction |
SG | Specific gravity |
SMEB | Sociedad Minera El Brocal S.A.A. |
SPT | Standard penetration testing |
SR | Stripping ratio |
SRK | Srk consulting (peru) s.a. |
st | Short tonne (2,000 pounds) |
SVR | Surveillance reports |
t | Tonne (metric tonne) (2,204.6 pounds) |
t/d | Tonnes per day |
t/h | Tonnes per hour |
t/y | Tonnes per year |
TC | Treatment charge |
TCs | Treatment costs |
Time Domain EM | The geophysical methods used included electromagnetism |
tpd | Tons per day |
TSF | Tailing’s storage facility |
TSP | Total suspended particulates |
UG | Underground |
UIT | One tax unit |
V | Volts |
VFD | Variable frequency drive |
W | Watt |
WRA | Total rock chemical analysis |
WWTPI | Industrial wastewater treatment plant |
XRD | X-ray diffraction |
y | Year |
Zn | Zinc |
| May, 2022 |
SRK Consulting Peru SA SEC Technical Report Summary – El Brocal | Page 1 |
Executive Resume |
Summary |
SRK Consulting (Peru) S.A., (SRK) was retained by Compañia de Minas Buenaventura S.A.A. to prepare an independent Technical Report Summary on the El Brocal Mine, located in the Department of Pasco, Peru. Compañía de Minas Buenaventura S.A.A. is a publicly traded company on the New York Stock Exchange (NYSE).
This report was prepared as a PFS Technical Report Summary in accordance with the Securities and Exchange Commission (SEC) S-K regulations (Title 17, Part 229, Items 601 and 1300 until 1305) for Compañia de Minas Buenaventura S.A.A. (NYSE: BVN) by SRK Consulting (Peru) S.A. (SRK) on the Technical Report Summary for El Brocal (TRS)
The purpose of this Technical Report Summary is to report Mineral Resources, mineral reserves and exploration results.
This report is based in part on internal Company technical reports, previous prefeasibility studies, maps, published government reports, company letters and memoranda, and public information as cited throughout this report and listed in the References Section 24.
Reliance upon information provided by the registrant is listed in the Section 25 when applicable.
The Colquijirca - Marcapunta (El Brocal) production unit is owned by Sociedad Minera El Brocal SAA (61.00% Buenaventura), a subsidiary of Buenaventura.
Colquijirca Mining District has a long productive history dating back to pre-Inca, Inca, and colonial times, and has mainly focused on silver mining. It was a key producer of Ag and Bi during the first half of the 20th century (Buenaventura, 2021) and is currently one of the largest producers of Zn-Pb-Ag.
El Brocal is located in the district of Tinyahuarco, province of Cerro de Pasco, department of Pasco, Peru, at coordinates 10°45'8.9'' S and 76°16'21.8'' W, 289 km from Lima and 10 km from the city of Cerro de Pasco, at an altitude of approximately 4,300 MASL.
Sociedad Minera El Brocal S.A.A. conducts its mining operations using the open pit method at Tajo Norte mine (silver, lead, and zinc ores) and the underground method at Marcapunta mine (copper ores). The Marcapunta Oeste and San Gregorio are the Company’s most important exploration projects
El Brocal’s mineral processing facilities include two independent conventional flotation plants. Plant 1, which processes copper ore, and Plant 2, which processes lead and zinc ores. Plant 1 receives ore from Marcapunta mine, and Plant 2 receives fresh ore from Tajo Norte mine and low silver content ore from Marcapunta. For the period 2017 to November 2020, the combined plants processed approximately 22.8 million tons of fresh ore, which is equivalent to an average of 5.7 million per year or 15,600 tons per day (approximately) when considering 365 days per annum. The plants’ combined nominal capacity is 18,000 tons per day.
Conclusions |
SRK has the following conclusions by area.
SRK Consulting (Peru) S.A. | May, 2022 |
SRK Consulting Peru SA SEC Technical Report Summary – El Brocal | Page 2 |
a. | Geological and Mineral Resources |
● Due to years of active mining, geology and mineralization are well understood and SRK has used relevant available data sources to integrate information on long-term resource scale into the modeling effort for public reporting purposes.
● The geological setting, geophysical studies, surface samples, and geological mapping of the Colquijirca area present good exploration potential. Marcapunta Sur Oeste and San Gregorio are the most important exploration projects.
● Protocols for drilling, sampling preparation and analysis, verification, and security meet industry-standard practices are appropriate for use in a Mineral Resource estimate.
● The geological models are reasonably constructed using available geological information and are appropriate for Mineral Resources estimation.
● The assumptions, parameters, and methodology used for the El Brocal Mineral Resources estimate are appropriate for the style of mineralization and proposed mining methods.
● The process to estimate the Mineral Resources of the El Brocal mine was conducted by SRK and Buenaventura. A 3D geological model (lithological, structural and mineralization bodies) was elaborated with several types of data (mainly drill holes, working mapping and section interpretation) to constraint and control ore shapes and domains.
● Drilling data from cores were combined into geological structures, copper, zinc, lead, silver, gold, and iron grades were interpolated into block models for the different mine zones using the Ordinary Kriging method in each domain. The results were visually validated through various statistical comparisons. The estimate was sterilized with the previously extracted areas before the date of this report; classified in a manner consistent with industry standards; and reviewed with Buenaventura.
● Mineral Resources have been reported using an optimized scenario (stopes and pit), based on operational and economic assumptions to support the reasonable potential for economic extraction of the Mineral Resource. The cutoff has been calculated from economic parameters, and the resources have been reported above this cutoff.
● For SRK, the Mineral Resources set forth herein are appropriate for public disclosure and meet the definitions of measured, indicated and inferred resources established by SEC guidelines and industry standards (S-K 1300).
b. | Sample Preparation, Analysis and Security |
● SRK has conducted a comprehensive review of the available QA/QC data as part of the sample preparation, analysis, and security. SRK believes that the QA/QC protocols are consistent with the best practices accepted in the industry.
● The sample preparation, chemical analysis and quality control procedures historically have shown that there may be issues with the accuracy and precision of samples results to support the estimation of measured Mineral Resources and proven reserves, especially for areas characterized by analyses at the El Brocal Internal Laboratory. Therefore, SRK has considered the QA/QC analysis results as a risk in the classification of Mineral Resources and reduced the overall classification.
c. | Data Verification |
● SRK notes that the database has a minor quantity of inconsistencies, which primarily correspond to historical information obtained from data migration and not deemed material to the disclosure of Mineral Resources. SRK believes that the database is consistent and acceptable for Mineral Resources Estimation.
d. | Mining and Mineral Reserves |
● In the SRK’s opinion the mineral reserves estimation is reasonable in the context of available technical studies, information provided by Buenaventura an assessment
SRK Consulting (Peru) S.A. | May, 2022 |
SRK Consulting Peru SA SEC Technical Report Summary – El Brocal | Page 3 |
developed by SRK, however, SRK strongly recommend to monitoring the following risk aspects: identified by SRK: Mining dilution and mining recovery
● Currency exchange rate
● Production costs
● Geotechnical parameters
● Processing plant throughput
● Deleterious elements presence,
● Local politics
e. | Mineral Processing |
Plant 1’s operating time averaged 88.8%; it should operate in the 90% to 95% range, or even higher.
Arsenic in copper concentrate is high, ranging from 8% to 8.5% for both products.
Copper Concentrate 1 production bearing silver values represent the largest fraction, or approximately 99.6% of the approximately 180,000 t/year produced; the balance, or 0.4%, was Copper Concentrate 2 with no declared silver content.
Currently Plant 2 process copper ore by campaigns of approximately 30 days/ year.
f. | Environmental, Permitting, and Social Considerations |
SRK has concluded that the main activities and components for mining and beneficiation at Colquijirca and Marcapunta Units have obtained statutory Environmental Certifications. SRK has come to the same conclusion regarding the mine’s ancillary components. of the mine.
g. | Capital and Operating Costs |
In the SRK’s opinion, the operating cost estimation is reasonable in the context of LoM plan, premises, operational conditions, the information provided by Buenaventura and the assessment developed by SRK. SRK considers that the use of historical record provides a good approximation of the reality of the operation and allows for adequate projection of future costs.
Closure costs were estimated by SRK at +-25% accuracy level. In aspects where the technical information was not enough or due to the lack of technical studies, allowances were considered to cover any unknown technical issue. In the SRK’s opinion, the closure cost is reasonable and reflects the reality of El Brocal’s environmental conditions. The closure cost estimated by SRK looks to cover the requirements of local and international regulations. This cost is higher than closure costs estimated by Buenaventura and presented to the local government entities
Capital cost expenditure was estimated by Buenaventura and in SRK’s best understanding, was estimated following best practices and in accordance with conditions at El Brocal. SRK finds the amounts reasonable for the type and size of El Brocal’s operation. However, SRK cannot develop a detailed analysis of the capital costs or provide support for the same.
SRK recommends monitoring the following aspects:
● Additional engineering studies related to the mine closure process,
● Monitor the currency exchange rate;
SRK Consulting (Peru) S.A. | May, 2022 |
SRK Consulting Peru SA SEC Technical Report Summary – El Brocal | Page 4 |
● Prepare support for the capital cost expenditure.
h. | Economic Analysis |
Based on the assumptions detailed in this report, the operation is forecasted to generate positive cashflow over the life of the reserves. This estimated cashflow is inherently forward-looking and dependent upon numerous assumptions and forecasts, such as macroeconomic conditions, mine plans and operating strategy, all of which are subject to change.
This yields an after-tax LoM NPV@ 7.77% of US$277M, of which US$169M is attributable to Buenaventura.
The analysis performed for this report indicates that the operation’s NPV is most sensitive to variations in commodity prices and in plant performance.
Recommendations |
a. | Geological Setting, mineralization and Deposit |
● SRK recommends developing a detailed structural model to provide further support to the geologic modeling of the deposit.
b. | Mineral Resources |
● SRK recommends that systematic density sampling programs be carried out covering all ore bodies, adequately distributed along the length and height of the veins.
● QAQC results throughout the life of the mine have not been optimal. SRK recommends that the quality control program be properly monitored. Internal laboratory results over the last few months on Au and Cu show accuracy problems and potential problems on Ag. These inappropriate results generated the non-declaration of measured resources in the southern zone.
● SRK strongly suggests that a feasibility-level structural model be developed throughout the mine, especially in the southern area. Currently, the low confidence of the structural model means that the southern part does not have measured resources.
● SRK recommends implementing a reconciliation program where the different types of resource models, reserves, mine plans and plant results are included.
c. | Sample Preparation, Analysis and Security |
SRK recommends frequently analyzing the results of control samples, particularly with regard to the precision and accuracy of the Internal Laboratory and Certimin External Laboratory, to identify any inconsistencies and provide immediate solutions.
d. | Data Verification |
SRK recommends performing internal validations of the database; conducting periodic verification of the data export process; and issuing Internal Laboratory analytical certificates for future estimations or audits.
e. | Mining and Mineral Reserves |
● Improvement of metallurgical recovery estimation by means of a continuous performance control of plant operations and development of additional metallurgical tests. SRK considers that current formulas are coherent with the processing plants and represent the results of the process, however, it is necessary to complete additional analysis.
SRK Consulting (Peru) S.A. | May, 2022 |
SRK Consulting Peru SA SEC Technical Report Summary – El Brocal | Page 5 |
● Develop a definition of metallurgical recovery schema for ore materials that can produce a bulk concentrate (Cu, Pb, Ag) and incorporate it as part of mineral reserves estimation.
● Improvement of “unit value” calculation by means the parameters traceability and adding some level of differentiation in the commercial terms, separating commercial terms related to the metal or payable content and commercial terms related to mass of concentrate
● Improve the predictability of Arsenic contents in the saleable products of the LoM plan. And based on that the impact in trhe valuation of concentrates and in-situ or.
● Geotechnical monitoring of open pit slopes and implement feedback process to incorporate the monitoring results to the geotechnical model used for pit design purposes
● Implement a reconciliation process, following best practices of the industry. This process must be consider the involvement of areas: mine operations, geology, mine planning and processing plant under an structured plan of implementation;
f. | Environmental, Permitting, and Social Considerations |
Achieve the goals programmed in the social management plan that were pending due to the Covid 19 restrictions.
g. | Capital and Operating Costs |
● Development of additional technical studies for the mine closure process and to improve the accuracy of cost estimation. SRK believes that there are opportunities to improve and reduce the closure costs supported by technical studies;
● Continuous monitoring of cost results (yearly, quarterly); these results should be used as feedback on the operating and capital cost estimation.
● Complete the studies for the cemented backfill and based on the findings, update capital cost requirements.
● Develop a detailed cost estimation for the production of bulk concentrate.
Economic Analysis |
The operation is forecast to generate positive cashflow over the life of the reserves, based on the assumptions detailed in this report. This estimated cashflow is inherently forward-looking and dependent upon numerous assumptions and forecasts, such as macroeconomic conditions, mine plans and operating strategy, that are subject to change.
This yields an after-tax LoM NPV@ 7.77% of US$277M, of which US$169M is attributable to Buenaventura.
The analysis performed for this report indicates that the operation’s NPV is most sensitive to variations in the commodity price and plant performance
Technical Summary |
This report was prepared as a Prefeasibility-level Technical Report Summary in accordance with the Securities and Exchange Commission (SEC) S-K regulations (Title 17, Part 229, Items 601 and 1300 until 1305) for Compañia Minera Buenaventura S.A.A. (Buenaventura) by SRK Consulting (Peru) S.A. (SRK) on the El Brocal Mine .
SRK Consulting (Peru) S.A. | May, 2022 |
SRK Consulting Peru SA SEC Technical Report Summary – El Brocal | Page 6 |
Colquijirca is held within the operating entity, Sociedad Minera El Brocal (El Brocal), of which Buenaventura is a 61.43% owner with the remaining 38.57% ownership controlled by Sociedad Minera EL Brocal S.A.A.
Property Description |
El Brocal is a polymetallic mining company, dedicated to the extraction, concentration and commercialization of silver, lead, zinc and copper minerals. It carries out its operations in the Colquijirca Mining Unit and Huaraucaca Concentrator Plant, located in the district of Tinyahuarco, province of Pasco, department and region of Pasco.
El Brocal is located in the district of Tinyahuarco, province of Cerro de Pasco, department of Pasco, Peru, at coordinates 10°45'8.9'' S and 76°16'21.8'' W, 289 km from Lima and 10 km from the city of Cerro de Pasco, at an altitude of approximately 4,300 MASL.
El Brocal exploits two adjoining mines: Tajo Norte, an open-pit operation that produces silver, lead, zinc and copper ores; and Marcapunta, an underground mine that produces copper minerals. The extracted ore is processed in two concentrator plants, which currently have an installed treatment capacity of 18,000 metric tons per day.
The main access from Lima is via the Carretera Central highway to Cerro de Pasco - Colquijirca (298 km). The unit can also be accessed by air from Lima (Jorge Chavez airport) to Huanuco (Alferez FAP David Figueroa Fernandini) and then by land via the Huanuco - Chicrin paved road (approximately 81 km to the site).
Land tenure |
Colquijirca has a Mineral concession grouping known a “Accumulation Brocal,” which covers area of 34,386 ha, and one beneficiation concession, which covers an area of 976 ha. The concessions are in the districts of Tinyahuarco, province of Cerro de Pasco, department of Pasco, Peru.
The Colquijirca - Marcapunta (El Brocal) production unit is owned by Sociedad Minera El Brocal (61.43% Buenaventura), a subsidiary of Buenaventura.
History |
Colquijirca has a long productive history: Ag (Au) ore was mined in pre-Inca, Inca, and colonial times. During the first half of the 20th century, the area became an important producer of Ag and Bi. In 1956, the mining operation was registered as "Sociedad Minera El Brocal S.A." In 1994, an aggressive exploration program began through diamond drilling, which allowed the company to identify and quantify San Gregorio and Marcapunta Projects. In August 2008, capacity was ramped up to 18,000 MTD. Currently, Colquijirca is one of the largest producers of Zn-Pb-Ag and Cu (Au) in Peru.
Geological and Mineralization |
The Colquijirca mining district is located on rocks belonging to the Excelsior Group phyllites, sandstones and red conglomerates of the Mitu Group, followed by marine limestones of the Pucara Group, and towards the top, conglomerates, and continental facies of carbonate breccias of the Calera Formation. These units are intruded by the middle Miocene Marcapunta volcanic complex.
Colquijirca has a Mineral concession grouping known a “Accumulation Brocal,” which covers area of 34,386 ha, and one beneficiation concession, which covers an area of 976 ha. The concessions are in the districts of Tinyahuarco, province of Cerro de Pasco, department of Pasco, Peru.
SRK Consulting (Peru) S.A. | May, 2022 |
SRK Consulting Peru SA SEC Technical Report Summary – El Brocal | Page 7 |
Exploration Status |
SRK notes that the property is an active mining operation with a long history and that results and interpretation from exploration data are generally supported in more detail by extensive drilling and by active mining exposure of the orebody in pits and underground works.
The area around the Colquijirca Operations has been extensively mapped, sampled, and drilled over several years of exploration work. For the purposes of this report, active mining, and extensive exploration drilling, should be considered the most relevant and robust exploration work for the current Mineral Resources estimation.
Mineral Resources Estimates |
The 2021 Mineral Resources Model has been updated by SRK and was based on drill hole information. The resource classification was performed by Buenaventura and reviewed and validated by SRK.
SRK generated geological models in each lithology unit modeled by Buenaventura, which were used as estimation domain based on drilling data. Mineralized domains identifying potentially economically mineable material were modeled using the indicator tool in Leapfrog Geo to generate grade envelopes (grade shells). Estimation domains are used to code drill holes for geostatistical analysis, block modeling, and grade interpolation by ordinary kriging. Drilling data was composited to 2.5 m length samples within relevant grade shell wireframe and grade capping was assessed by element and domain.
Net smelter return (NSR) values for each mining block consider expected terms of trade, average metallurgical recovery, the average grade in concentrate and projected long-term metal prices. Mineral Resources consider operating costs and have been reported above an NSR cut-off differentiated value.
The resource classification considers several aspects that affect the confidence in the resource estimate, including geological continuity and complexity; data density and orientation; accuracy and precision of the data; and continuity of grade. Mineral Resources are classified as measured, indicated or inferred. The criteria used for the classification include the number of samples, the spatial distribution, accuracy of the estimation, the risk associated with the low performance of the QAQC samples and the absence of a detailed structural model in the southern part, the distance from the block centroid and the confidence limits methodology.
Mineral Resources excluding Mineral Reserves of the El Brocal Mine are reported as of December 3, 2021, and are detailed in Table 1-1.
Table 1-1: Summary of Mineral Resources
Zn-Pb Mineral Resources Statement, Open Pit
Resources | Category | Tonnes | Ag | Pb | Zn | Cu | As | Fe | NSR |
000's | Oz/t | % | % | % | % | % | US$/t | ||
Zn-Pb ore | Measured | 1,089 | 0.47 | 1.25 | 3.78 | 0.01 | 0.00 | 17.71 | 42.51 |
Indicated | 1,292 | 1.22 | 0.91 | 3.05 | 0.07 | 0.03 | 13.48 | 48.76 | |
Measured & Indicated | 2,381 | 0.88 | 1.06 | 3.39 | 0.04 | 0.02 | 15.41 | 45.90 | |
Inferred | 1,986 | 3.31 | 0.33 | 1.02 | 0.07 | 0.09 | 8.69 | 65.63 |
SRK Consulting (Peru) S.A. | May, 2022 |
SRK Consulting Peru SA SEC Technical Report Summary – El Brocal | Page 8 |
Cu Mineral Resources Statement, Open Pit
Resources | Category | Tonnes | Ag | Pb | Zn | Cu | As | Fe | NSR |
|---|---|---|---|---|---|---|---|---|---|
000’s | Oz/t | % | % | % | % | % | US$/t | ||
Cu ore | Measured | 28 | 4.48 | 0.25 | 0.44 | 2.95 | 0.66 | 4.88 | 196.32 |
Indicated | 1,173 | 0.83 | 0.11 | 0.23 | 1.72 | 0.44 | 7.34 | 85.91 | |
Measured & Indicated | 1,201 | 0.92 | 0.12 | 0.23 | 1.75 | 0.44 | 7.28 | 88.49 | |
Inferred | 13,844 | 0.49 | 0.08 | 0.07 | 1.54 | 0.39 | 11.77 | 73.05 |
Cu Mineral Resources Statement, Underground Mine
Resources | Category | Tonnes | Ag | Cu | Au | As | Fe | NSR |
000’s | Oz/t | % | g/t | % | % | US$/t | ||
Cu ore | Measured | 893 | 1.33 | 2.64 | 1.04 | 0.86 | 19.17 | 152.56 |
Indicated | 28,704 | 0.80 | 1.59 | 0.87 | 0.53 | 20.43 | 92.35 | |
Measured & Indicated | 29,597 | 0.81 | 1.62 | 0.88 | 0.54 | 20.39 | 94.17 | |
Inferred | 19,679 | 0.73 | 1.76 | 0.80 | 0.53 | 16.31 | 98.77 |
Source: Buenaventura, 2021 (Buenaventura, 2021)
Notes to accompany Mineral Resources tables:
● The reference point for the Mineral Resources estimate is insitu. The estimate has an effective date of 31 december, 2021. The Qualified Person Firm responsible for the resource estimate is SRK Consulting (Peru) S.A.Mineral Resources are reported exclusive of those Mineral Resources converted to mineral reserves. Mineral Resources that are not mineral reserves do not have demonstrated economic viability.
● Resources have been reported as in situ (hard rock within optimized pit shell and stopes).
● Resources have been categorized subject to the opinion of a QP based on the amount/robustness of informing data for the estimate, consistency of geological/grade distribution, survey information, and have been validated against long term mine reconciliation for the in-situ volumes.
● The estimate uses the following key input parameters: commodity prices of 8,000 USD / t Cu, 1,600 USD / Oz Au, 25 USD / Oz Ag, 2,286 USD / t Pb and 2,385 USD / t Zn; life-of-mine average metallurgical recoveries was assigned to the block model using defined functions, sublevel stopping mining method is considered; inclusion of internal and external dilution; mining costs; processing costs; no allocation for general and administrative costs; and an allocation for sustaining capital cost. All these parameters can be seen in detail in Table 11-21, 11-22, 11-23 and 11-24.
● Mineral Resources are reported inside optimized pit and optimized stopes designed above a net smelter return cut-off of: for Open Pit: Zn: 27.14 USD / t ; Cu: 25.95 USD / t; and for Underground: North an Center: 38.9 USD / t; Southeast and Southwest: 37.5 USD / t and Southwest 2 and South: 41.1 USD / t
● The NSR equations are:
Open Pit: GradeZn(%)*11.12*Recovery Zn(%)+GradeAg(Oz/t)*15.87*Recovery AgZn(Oz/t)+GradePb(%)*12.93*Recovery Pb(%)+GradeAg(Oz/t)*21.36*Recovery AgPb(Oz/t))/100
Underground: GradeCu(%)*48.58*Recovery Cu(%)+GradeAu(g/t)*30.86*Recovery Au(g/t)+GradeAg(Oz/t)*19.18*RecoveryAg(Oz/t))/100
● Mineral Resources tonnage and contained metal have been rounded to reflect the accuracy of the estimate, and numbers may not add due to rounding.
Factors that may affect estimates include metal price and exchange rate assumptions; changes in the assumptions used to generate the cut-off grade; changes in local interpretations of the geometry of mineralization and continuity of mineralized zones; changes in geological form and mineralization and assumptions of geological and grade continuity; variations in density and domain assignments; geo-metallurgical assumptions; changes in geotechnical, mining, dilution
SRK Consulting (Peru) S.A. | May, 2022 |
SRK Consulting Peru SA SEC Technical Report Summary – El Brocal | Page 9 |
and metallurgical recovery assumptions; switch to design and input parameter assumptions of conceptual stope designs that constrain estimates; and assumptions as to the continued ability to access the site, retain title to surface and mineral rights, maintain environmental and other regulatory permits, and maintain the social license to operate.
There are no other known environmental, legal, title, tax, socioeconomic, marketing, political or other factors that could materially affect the estimate of Mineral Resources or Mineral Reserves that are not discussed in this Report.
Mineral Reserve Estimates |
Mineral reserves Estimation for El Brocal mine considers the uses of conventional open pit and underground methods to extract mineral reserves
Proven and probable mineral reserves are converted from measured and indicated Mineral Resources. Conversion is based on pit optimization results (only open pit), mine design, mine sequence and economic evaluation. The in situ value is calculated from the estimated grade and certain modifying factors.
The mine LoM plans and resulting mineral reserves stated in this report are based on pre-feasibility level studies.
Mineral reserves effective date is December 31st, 2021
Cost estimation are based on the historic cost of years 2018-2020. Forecast cost estimated considers criteria for future operational conditions and additional 10% contingency.
Mineral reserves are reported above internal NSR cut-off value for open pit materials and above marginal NSR cut-off value for underground materials. The marginal cut-off considers only the variable cost.
Metallurgical recovery is estimated and assigned to a block model attribute using the recovery functions defined for each element and concentrate.
SRK identified risks related to mining dilution and mining recovery, currency exchange rate, production costs, geotechnical parameters, processing plant throughput, deleterious elements presence and local politics. However, to the best of SRK’s knowledge and based on available technical studies and information provided by Buenaventura, not fatal flaw is present. In the QP’s opinion, the mineral reserves estimation is reasonable.
Summary mineral reserves are shown in the Table 1-2
Table 1-2: El Brocal Underground Summary Mineral Reserve Statement as of December 31st, 2021
Mining | Confidence | Tonnage | Copper | Silver | Gold | Arsenic |
|---|---|---|---|---|---|---|
Proven | 35 | 1.18 | 31.35 | 0.69 | 0.38 | |
R&P | Probable | 13,918 | 1.24 | 21.83 | 1.00 | 0.40 |
Primary | Sub-total | 13,953 | 1.24 | 21.85 | 1.00 | 0.40 |
SRK Consulting (Peru) S.A. | May, 2022 |
SRK Consulting Peru SA SEC Technical Report Summary – El Brocal | Page 10 |
Mining | Confidence | Tonnage | Copper | Silver | Gold | Arsenic |
|---|---|---|---|---|---|---|
R&P | Probable | 873 | 1.92 | 11.87 | 0.24 | 0.55 |
Pillar Recov | Sub-total | 873 | 1.92 | 11.87 | 0.24 | 0.55 |
R&P | Probable | 751 | 1.72 | 17.74 | 0.72 | 0.57 |
Remanent | Sub-total | 751 | 1.72 | 17.74 | 0.72 | 0.57 |
Probable | 16,908 | 1.33 | 23.35 | 0.61 | 0.50 | |
SLS | Sub-total | 16,908 | 1.33 | 23.35 | 0.61 | 0.50 |
Proven | 35 | 1.18 | 31.35 | 0.69 | 0.38 | |
TOTAL | Probable | 32,450 | 1.32 | 22.26 | 0.77 | 0.46 |
Total | 32,485 | 1.32 | 22.27 | 0.77 | 0.46 |
Source: SRK, 2021
(1) | Buenaventura's attributable portion of Mineral Resources and reserves is 61.00% (Amounts reported in the table corresponds to the total mineral reserves) |
(2) | The reference point for the mineral reserve estimate is the point of delivery to the process plant. |
(3) | Mineral reserves are current as of December 31st, 2021 and are reported using the mineral reserve definitions in S-K 1300. The Qualified Person Firm responsible for the estimate is SRK Consulting (Peru) SA |
(4) | Key parameters used in mineral reserves estimate include: |
(a) | Average long term prices of copper price of 8,000 US$/t, gold price of 1,600 US$/oz, silver price of 25.00 US$/oz, lead price of 2,286 US$/t, zinc price of 2,385 US$/t |
(b) | Variable metallurgical recoveries are accounted for in the NSR calculations and defined according to recovery functions, that average 84% for copper, 35% for gold and 52% for silver |
(c) | Mineral reserves are reported above a marginal net smelter return cut-off of 37.49 US$/t for room & pillar primary stopes, 38.94 US$/t for pillar recovery with cemented backfill, 38.76 US$/t for remanent ore recovery and 41.12 US$/t for sub level stoping mining methods. |
(d) | Underground ore is scheduled to be processed mainly in the Plant 1 (used to process Copper ore) |
(5) | Mineral reserves tonnage, grades and contained metal have been rounded to reflect the accuracy of the estimate, and numbers may not add due to rounding |
Table 1-3: El Brocal Open Pit Summary Mineral Reserve Statement as of December 31st, 2021
Ore Type | Confidence | Tonnage | Copper | Silver | Gold | Lead | Zinc | Arsenic |
|---|---|---|---|---|---|---|---|---|
Proven | 2,288 | 2.35 | 96.48 | 0.01 |
|
| 0.21 | |
Copper Ore | Probable | 24,059 | 1.64 | 15.56 | 0.24 |
|
| 0.43 |
Sub-total | 26,347 | 1.70 | 22.59 | 0.22 |
|
| 0.41 | |
Proven | 4,789 |
| 91.55 |
| 1.37 | 2.65 | 0.05 | |
Lead-Zinc Ore | Probable | 3,418 |
| 91.92 |
| 0.70 | 1.44 | 0.10 |
Sub-total | 8,207 |
| 91.70 |
| 1.09 | 2.15 | 0.07 |
Source: SRK, 2021
SRK Consulting (Peru) S.A. | May, 2022 |
SRK Consulting Peru SA SEC Technical Report Summary – El Brocal | Page 11 |
Buenaventura's attributable portion of Mineral Resources and reserves is 61.00% (Amounts reported in the table corresponds to the total mineral reserves) | ||
(2) | The reference point for the mineral reserve estimate is the point of delivery to the process plant. | |
(3) | Mineral reserves are current as of December 3stth, 2021 and are reported using the mineral reserve definitions in S-K 1300. The Qualified Person Firm responsible for the estimate is SRK Consulting (Peru) SA | |
(4) | Key parameters used in mineral reserves estimate include: | |
(a) | Average long term prices of copper price of 8,000 US$/t, gold price of 1,600 US$/oz, silver price of 25.00 US$/oz, lead price of 2,286 US$/t, zinc price of 2,385 US$/t | |
| (b) | Variable metallurgical recoveries are accounted for in the NSR calculations and defined according to recovery functions, that average for |
| (c) | Mineral reserves are reported above an internal net smelter return cut-off of 27.14 US$/t for open pit ore sent to Plant 2 (PbZn) and 25.95 US$/t for open pit ore sent to Plant 1 (Cu) |
| (e) | Open pit ore is scheduled to be processed in the Plant 1 (Copper ore) and Plant 2 (Lead-Zinc ore) |
(5) | Mineral reserves tonnage, grades and contained metal have been rounded to reflect the accuracy of the estimate, and numbers may not add due to rounding | |
(6) | It has not been generated total sum values. Both products do have not the same saleable and payable elements | |
1.3.8 | Mining Methods |
The underground mining methods are Sub level Stopping with cemented back fill and Room and Pillar with long holes. The pillars left in the ground are chain pillars that run along the entire mining direction and cover the mantle’s extension. This method varies depending on the mining sector. North Sector: the stope is 8 m wide stope and 28 m high, and length varies between 50 to 100 m; the pillar width has been set at 6 m in between open stopes. South Sector: which includes the Southwest and Southeast Zone: the stope is 14 m wide, 28 m high, and the length varies between 50 and 100 m, with a pillar width of 6 m in between open stopes. Recovery of ore pillars using cemented or detrital backfill is planned.
The open pit has the following design parameters: Bench height: 6 m, Berm width: variable between 5 and 8 m, Ramp width: considering equipment width, safety distances, and safety berm, the open pit have ramp widths of 12 m with a 10% slope, Optimum turning radius according to the equipment fleet is 6.4 m, Minimum loading width considering the excavator and the minimum spaces to carry out operational activities is 20 m. However, one excavator is expected to work with two trucks. As such, the estimated width can be up to 60 m.
Mineral Processing |
El Brocal operates two independent conventional flotation plants, namely Plant 1 and Plant 2. Plant 1 processes copper ore from Marcapunta mine to recover copper minerals in order to produce copper concentrate. Plant 2 processes lead and zinc ores from, mostly from the Tajo Norte mine, to recover lead and zinc minerals with the purposes of producing lead concentrate and zinc concentrate.
Plant 1 is a conventional concentration plant producing copper concentrate that is transported offsite by dump trucks, and to a lesser extent, rail cars, for sale to third parties. The plant’s unit processes include crushing, grinding, flotation, and thickening. Final tails are thickened and disposed of in a conventional tailing’s storage facility. Final concentrate generated in the flotation stage is thickened, then dewatered before being sent to Callao Port. Copper concentrate production reached typical commercial quality grades for copper of around 25% but also contained
SRK Consulting (Peru) S.A. | May, 2022 |
SRK Consulting Peru SA SEC Technical Report Summary – El Brocal | Page 12 |
high arsenic (Enargite minerals) values around 8% or higher. This makes it difficult to sell in the open market.
Plant 2 (11,500 tonnes/day) is a conventional, sequential multi-stage concentrator that produces lead and zinc concentrates that are trucked offsite to be sold to third parties. The plant’s unit processes include crushing, washing, grinding, and flotation. Final tails are thickened and disposed of in a conventional tailing’s storage facility. Final concentrates are thickened and dewatered before being trucked off site.
Both Plant 1 and Plant 2 operation and metallurgical performance suggest that significant improvements are needed. Grinding product size is highly unsteady with major fluctuations from day to day in grinding. Similarly daily throughput is also showing uncharacteristic variability on a day-to-day basis. Both processing facilities also exhibit operating time significantly below the industry standard of 90% to 95%. Tajo Norte seems to be unable to supply enough ore to operate Plant 2 at full capacity.
A comprehensive metallurgical program is necessary to support the metallurgical parameters for industrial scale operation when processing future ore. This testing program results should also be the benchmark for future industrial scale performance.
Infrastructure |
The in-situ and operating infrastructure at El Brocal includes the following:
● The Condorcayan waste rock management facility
● Huachuacaja tailings management facility and ancillary facilities
● Mine Operations Support Facilities (main facilities are: Access ramps, underground workshop, administration buildings, maintenance workshops, explosive storage, etc.)
● Processing Plant Support Facilities
● Power Supply and distribution: The power supply for the project is obtained from two hydroelectric power stations owned by Sociedad Minera El Brocal (SMEB) and Electroandes. The mining unit energy is provided from the following facilities:
● Water Supply: Water Source comes from the Pun Run lagoon and the Blanco River. The freshwater reservoir has a capacity of 2,300 m³)
● Domestic water treatment plants:
● Waste Water Treatment: Acid water: 240L/s of acid water through the High-Density Sludge process. Domestic wastewater treatment plants (PTARD) Solid Waste Disposal has an area of 6.5 ha.
Market Studies |
Buenaventura’s copper concentrate has substantial payable metal content. It has high copper and silver, with reasonable gold content. However, the product has very high arsenic content. With arsenic levels of 6.5-9.5%, this would make selling the concentrate directly to smelters almost impossible, as they would have to extensively blend the product to reach a more generally acceptable level of 0.2% As content (although certain smelters are capable of processing higher levels).
Buenaventura’s zinc concentrate from El Brocal has a relatively standard zinc content and high silver content. This is one of the least complex products in Buenaventura’s portfolio and is generally regarded as a versatile product that has no problem finding a market. Although the high humidity of the concentrate is a minor element of concern, this has no impact on payability. Going
SRK Consulting (Peru) S.A. | May, 2022 |
SRK Consulting Peru SA SEC Technical Report Summary – El Brocal | Page 13 |
forward, Buenaventura has contracts in place with standard buyers committing 82% of El Brocal’s zinc concentrate production in 2022, and 21% in 2023. The business relationship with these buyers is ongoing and negotiations are expected to continue in the future.
Environmental Studies, Permitting, and Plans, Negotiations, or Agreements with Local Individuals or Groups |
SRK has confirmed that the Colquijirca Unit’s PAMA was approved by the regulatory authority in 2002. Subsequently, that mine received approval for several EIAs for different components and expansions of the operation (2001, 2004, 2008, 2011, 2014; amendments to these studies (2012); and complied with minor or environmentally non-significant variations of the STR (2016, 2017, 2018, 2019, and 2021) as well as with elements of prior communications.
After reviewing the descriptive scope of the documents identified above, SRK has concluded that the main activities and components for mining and beneficiation at Colquijirca MU have obtained statutory Environmental Certifications. SRK has come to the same conclusion regarding the ancillary components of the mine.
From the review of available documents, SRK was able to corroborate that the Colquijirca MU has mining rights for its mining and ancillary activities and possesses the corresponding operating permit from the mining authority.
SRK’s review of available documents corroborates that the Colquijirca MU has the corresponding permits to develop its mining beneficiation activities.
The unit has water use rights to meet its operational needs, both for human consumption (DWTP in the Colquijirca and Huaraucaca areas; staff camp, Camp's Pavilion G, Huaraucaca offices, etc.) and for industrial mining purposes.
The mine owner declares that “discharges occur solely at WWTPi, Huaraucaca DWWTP, and Jupayragra Power Plant”, which are covered by the corresponding authorizations,
Regulations require that the water provided for human consumption meet specific conditions for quality. To this end, DWTPs must have the corresponding sanitary authorization for the water treatment system. SRK verified that said authorization has been obtained for the Colquijirca mining camp and the Huaraucaca mining camp DWTPs.
SRK also verified that the mine received sanitary authorization for septic tanks and land infiltration in 2011.
SRK verified that the operation possesses a Certificate of Non-existence of Archaeological Remains for the Colquijirca Unit, Huachuacaja area, and Marcapunta
Colquijirca MU's activities comply with the legal requirement of having presented measures for the progressive, final, and post-closure of its existing and planned components. From the information contained in the Semiannual Mine Closure Plan Compliance Reports, SRK has concluded that the following progressive closure works are potentially delayed or non-compliant with respect to the approved Mine Closure Plan:
● Unish waste dump physical and geochemical stability works.
● Santa Maria waste dump physical and geochemical stability works.
● Drilling rig disassembly, physical stability, and geochemical stability works.
● Livestock Improvement Program, Environmental Education & Training Program, and Monitoring Training - Social.
SRK Consulting (Peru) S.A. | May, 2022 |
SRK Consulting Peru SA SEC Technical Report Summary – El Brocal | Page 14 |
The current social management plan of Colquijirca Mining Unit - El Brocal - BUENAVENTURA S.A.A. includes instruments in place prior to the unit’s acquisition in 2018, but some goals have been rescheduled due COVID-19 and to reflect the company’s desire to strengthen social relations by fulfilling obligations and commitments acquired with the population of the area of interest and direct/indirect influence. When Corporación Buenaventura purchased El Brocal, it assumed commitments made by the previous owners to ensure that good social relationships are developed obtained. Of the 45 obligations reviewed, 73% have been executed within the time and budget allocated prior to ot the initiation of the progressive closure stage. Slight delays in execution are attributable to COVID-19 restrictions and social distancing requirements, which impeded the execution of a number of social initiatives. To avoid contagion, participatory training and monitoring, for example, could not be conducted; this is reflected in the weighted progress. The COVID-19 context has weakened community relations and the ADSI and AISI have been unable to conduct planned visits to the community. It is clear that the Social Affairs Area of the mining unit requires more support to implement its strategy, which seeks to strengthen and improve community relations to lay the groundwork to acquire land or areas of interest to expand the Colquijirca mining operation down the line.
Capital and Operating Costs |
SRK has estimated the capital and operating cost based on the review and analysis of::
● Historical operating costs from 2018 to 2020, including a detailed analysis of the cost database and compilation of costs for forecast estimation;
● Projected capital cost for the LOM of El Brocal, including sustaining CAPEX
● Closure cost estimation developed by SRK
The summary estimated cost is shown in the Table 1-4.
Table 1-4: Summary estimates cost
Item ** | Units | Estimated cost * |
|---|---|---|
Mining Open Pit |
|
|
Waste | US$ / t waste | 1.87 |
Ore | US$ / t ore | 2.32 |
Mining Underground |
|
|
R&P Primary | US$ / t ore | 27.88 |
R&P Remanent | US$ / t ore | 29.15 |
R&P Pillar Recov | US$ / t ore | 29.33 |
SLS | US$ / t ore | 31.51 |
Plant Processing |
|
|
Plant 1 (Cu) | US$ / t processed | 17.47 |
Plant 2 (PbZn) | US$ / t processed | 16.28 |
G&A Mine Operations | US$ / t processed | 6.84 |
Sustaining CAPEX |
|
|
Mining | US$ / t ore | 1.38 |
Processing | US$ / t processed | 2.29 |
Off Site Cost (Corporate) *** | M US$ / year | 8.14 |
Other costs |
|
|
SRK Consulting (Peru) S.A. | May, 2022 |
SRK Consulting Peru SA SEC Technical Report Summary – El Brocal | Page 15 |
Item ** | Units | Estimated cost * |
|---|---|---|
Incremental cost **** | US$ / bench - t rock | 0.011 |
Voids research ***** | US$ / t rock | 6.85 |
Source: Buenaventura | ||
* Some items, depending on the cost type, do not include a contingency | ||
** Estimation does not include selling expenses and some commercial costs stated by the contract with the trader. These costs are included directly in the Cashflow | ||
*** Average forecast corporate cost (2022-2032) attributable to El Brocal mining unit | ||
**** Estimated for a bench height of 6 m | ||
***** Cost is applied only to blocks adjacent to zones with the potential existence of voids | ||
The capital cost estimated by Buenaventura totals 288.96 MUS$ for the LoM. No further details on concepts or infrastructure are added to the amount received from Buenaventura.
SRK estimated the closure cost (additional details can be found in Section Error! Reference source not found.) for all three stages of the closure process and has included a capital and operating cost estimation for a water treatment plant. A summary of total closure costs is shown in Table 1-5
Table 1-5: Summary of total closure costs
Period | Progressive closure | Final Closure | Post Closure | Water treatment | |||||||
Direct | Indirect | Direct | Indirect | Direct | Indirect | Direct | Indirect | ||||
2022-2033 | 134.47 | 14.74 |
|
|
|
|
|
| |||
2034-2038 |
|
| 19.06 | 8.71 |
|
|
|
| |||
2037-2056 |
|
|
|
| 0.50 | 0.27 |
|
| |||
2034-2056 |
|
|
|
|
|
| 1.32 | 51.68 | |||
Source: Buenaventura
Economic Analysis |
El Brocal’s operation consists of an open pit and underground mine and processing facilities. The operation is expected to have a 11-year life;
El Brocal’s operation consists of an open pit and underground mine and processing facilities. The operation is expected to have a 11-year life; the first year of operation is modeled.
The economic analysis metrics are prepared on an annual after tax basis in US$. The results of the analysis are presented in Table 1-6. The results indicate that the operation returns an after-tax NPV@7.77% of US$277M (US$169M attributable to Buenaventura). Note that because the mine is operating and is valued on a total project basis where prior costs are treated as sunk, IRR and payback period analysis are not relevant metrics.
SRK Consulting (Peru) S.A. | May, 2022 |
SRK Consulting Peru SA SEC Technical Report Summary – El Brocal | Page 16 |
Table 1-6: Indicative Economic Results
Units | Value | |
LoM Cash Flow (Unfinanced) | ||
Total Net Sales | M US$ | 4,569.74 |
Total Operating cost | M US$ | 3,352.76 |
Total Operating Income | M US$ | 293.17 |
Income Taxes Paid | M US$ | 32.16 |
EBITDA | ||
Free Cash Flow | M US$ | 991.76 |
NPV @ 7.77% | M US$ | 707.72 |
After Tax | ||
Free Cash Flow | M US$ | 320.18 |
NPV @ 7.77% | M US$ | 277.03 |
Source: SRK
SRK Consulting (Peru) S.A. | May, 2022 |
SRK Consulting Peru SA SEC Technical Report Summary – El Brocal | Page 17 |
Introduction |
Registrant for Whom the Technical Report Summary was Prepared |
This Technical Report Summary was prepared by SRK Consulting (Peru) S.A. for Minas Buenaventura S.A.A. (61.43% owner of Sociedad Minera El Brocal) in accordance with the Securities and Exchange Commission (SEC) S-K regulations (Title 17, Part 229, Items 601 and 1300 through 1305) and covers the Colquijirca Project.
Terms of Reference and Purpose of the Report |
The quality of information, conclusions, and estimates contained herein are consistent with the services provided by SRK and are based on i) information available at the time of preparation and ii) the assumptions, conditions, and qualifications set forth in this report. This report is intended for use by Buenaventura subject to the terms and conditions of its contract with SRK and relevant securities legislation. The contract permits Buenaventura to file this report as a Technical Report Summary with regulatory authorities in the U.S. pursuant to the SEC S-K regulations, more specifically Title 17, Subpart 229.600, item 601(b)(96) - Technical Report Summary and Title 17, Subpart 229.1300 - Disclosure by Registrants Engaged in Mining Operations. Except for the purposes regulated under provincial securities law, any other uses of this report by any third party are at said party’s sole risk. Buenaventura continues to be liable for this disclosure remains with Buenaventura.
The purpose of this Technical Report Summary is to report Mineral Resources, mineral reserves, and exploration results.
The effective date of this report is March 15, 2022.
Sources of Information |
This report is based in part on internal Company technical reports, previous feasibility studies, maps, published government reports, company letters and memoranda, and public information as cited throughout this report and listed in the References Section 24.
Reliance upon information provided by the registrant is listed in the Section 25 when applicable.
Details of Inspection |
Table 2-1 summarizes the details of the property inspections conducted by each qualified person or, if applicable, indicates the reasons why a personal inspection has not been completed.
SRK Consulting (Peru) S.A. | May, 2022 |
SRK Consulting Peru SA SEC Technical Report Summary – El Brocal | Page 18 |
Expertise | Date(s) of Visit | Details of Inspection | Reason why a personal inspection has not been completed |
Geology/ Resources | March, 2022 | •Laboratory •Geological Logging office •Mine Entrance | |
Metallurgy | March, 2022 | All process areas from the delivery of ROM ore to the final product ready for shipment-Chemical metallurgical laboratory Precious metals smelter and refinery area | |
Mining | January, 2021 | Visit the underground mine and open-pit operations zones, including production and development underground areas and two open-pit benches in production. The visit to the production stopes allowed to observe the application of the mining method and the sequence of activities of the mining cycle, this sequence was observed in the open pit operations as well. For open pit and underground the visual inspection of ground condition (and ground support used for UG), water presence, condition of auxiliary services and quick route of the surface infrastructure Meeting with planning and operations mine staff to review the current mine operations, short term and long term plans | |
Other Areas | | | Site Visit not completed due to Covid-19 travel restrictions |
Source: SRK
Report Version Update |
The user of this document should ensure that this constitutes the most recent Technical Report Summary available the property.
This Technical Report Summary is not an update of a previously filed Technical Report Summary.
SRK Consulting (Peru) S.A. | May, 2022 |
SRK Consulting Peru SA SEC Technical Report Summary – El Brocal | Page 19 |
Property Description |
The Colquijirca - Marcapunta (El Brocal) production unit is owned by Sociedad Minera El Brocal (61.43% Buenaventura), a subsidiary of Buenaventura.
Colquijirca Mining District has a long productive history dating back to pre-Inca, Inca, and colonial times, and has mainly focused on silver mining. It was a key producer of Ag and Bi during the first half of the 20th century (Buenaventura, 2021) and is currently one of the largest producers of Zn-Pb-Ag and Cu (Au).
Property Location |
El Brocal is located in the district of Tinyahuarco, province of Cerro de Pasco, department of Pasco, Peru, at coordinates 10°45'8.9'' S and 76°16'21.8'' W, 289 km from Lima and 10 km from the city of Cerro de Pasco, at an altitude of approximately 4,300 MASL. (Figure 3-1).
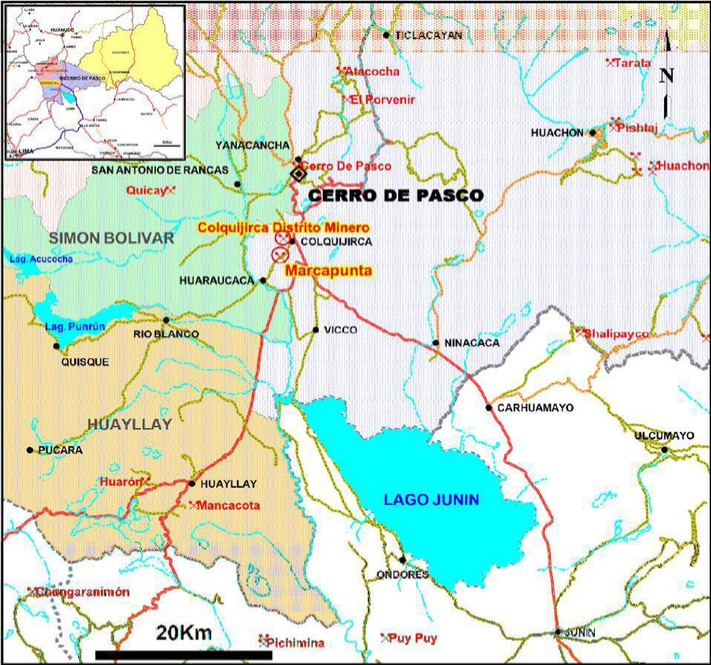
Figure 3-1 Location map of El Brocal mine, which comprises the deposits of Colquijirca, Marcapunta, and San Gregorio.
Source: (Buenaventura, 2021)
Property Area |
Sociedad Minera El Brocal S.A.A. conducts its mining operations using the open pit method at Tajo Norte mine (silver, lead, and zinc ores) and the underground method at Marcapunta Norte mine (copper ores). The Marcapunta Sur Oeste and San Gregorio are the Company’s most important exploration projects (El Brocal, 2019). Figure 3-2 shows the mining unit's map and its main mining operations.
SRK Consulting (Peru) S.A. | May, 2022 |
SRK Consulting Peru SA SEC Technical Report Summary – El Brocal | Page 20 |

Figure 3-2: Map of El Brocal mining operations and concentrator plant.
Source: Buenaventura, 2020
Mineral Title, Claim, Mineral Right, Lease or Option Disclosure |
El Brocal comprised of a group of mining concessions known as "Acumulación Brocal" and a beneficiation concession (concentrator). These concessions represent the area of mines and exploration projects (Figure 3-3).
SRK Consulting (Peru) S.A. | May, 2022 |
SRK Consulting Peru SA SEC Technical Report Summary – El Brocal | Page 21 |
Table 3-1: Information on the concessions of El Brocal mining property.
Claim ID | Name | Owner | As | Status | Date | Expiry | Area (Ha) |
010000121L | Acumulacion | Sociedad Minera | Mineral Right | Accumulation | 3/8/2021 | Does not | 34,386.84 |
P0100403 | Hda. de Benef. | Sociedad Minera | Mineral Right | Concentrator | 6/24/1981 | statutory duties | 976.68 |
Source: Buenaventura
SRK reports that all of the Mineral Resources and reserves presented in this report are within the concessions controlled by Sociedad Minera El Brocal.
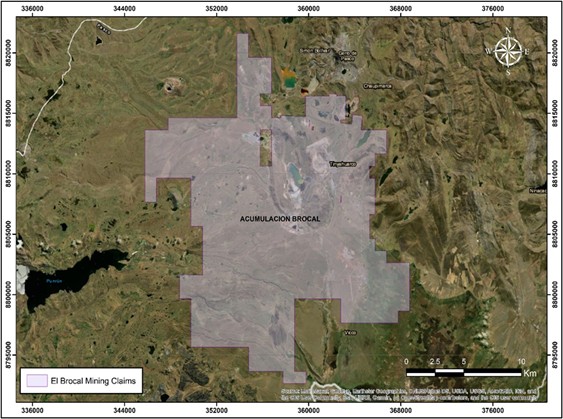
Figure 3-3: El Brocal mining claims
Source: (Buenaventura, 2021)
Mineral Rights Description and How They Were Obtained |
Property and Title in Peru (INGEMMET, 2021)
Overview
The right to explore, extract, process and/or produce minerals in Peru is primarily regulated by mining laws and regulations enacted by Peruvian Congress and the executive branch of government, under the 1992 Mining Law. The law regulates nine different mining activities:
SRK Consulting (Peru) S.A. | May, 2022 |
SRK Consulting Peru SA SEC Technical Report Summary – El Brocal | Page 22 |
reconnaissance; prospecting; exploration; exploitation (mining); general labor; beneficiation; commercialization; mineral transport; and mineral storage outside a mining facility.
The Ministry of Energy and Mines (MINEM) is the authority that regulates mining activities. MINEM also grants mining concessions to local or foreign individuals or legal entities through a specialized body: The Institute of Geology, Mining and Metallurgy (Ingemmet).
Other relevant regulatory authorities include the Ministry of Environment (MINAM), the National Environmental Certification Authority (SENACE), and the Supervisory Agency for Investment in Energy and Mining (Osinergmin). The Environmental Evaluation and Oversight Agency (OEFA) monitors environmental compliance.
Mineral Tenure
Mining concessions can be granted separately for metallic and non-metallic minerals. Concessions can range in size from a minimum of 100 ha to a maximum of 1,000 ha.
| ● | The mining concessions that have been granted will remain valid providing the concession owner complies with the following: |
| ● | Pays annual concession taxes or validity fees (derecho de vigencia), which are currently US$3/ha. Failure to pay the applicable license fees for two consecutive years will result in cancellation of the mining concession |
| ● | Meets minimum expenditure commitments or production levels. The minima are divided into two classes: |
| o | Achieve “Minimum Annual Production” by the first semester of Year 11, counting from the year after the concession was granted, or pay a penalty for non-production on a sliding scale, as defined by Legislative Decree N° 1320 which became effective on 1 January, 2019. “Minimum Annual Production” is defined as one tax unit (UIT) per hectare per year, which is S/4,200 in 2019 (about US$1,220) |
| o | Alternatively, no penalty is payable if a “Minimum Annual Investment” is made of at least 10 times the amount of the penalty. |
The penalty structure sets forth that if a concession holder cannot reach the minimum annual production by the first semester of the 11th year from the year in which the concessions were granted, the concession holder will be required to pay a penalty equivalent to 2% of the applicable minimum production per year per hectare until the 15th year. If the concession holder cannot reach the minimum annual production on the first semester of the 16th year from the year in which the concessions were granted, the concession holder will be required to pay a penalty equivalent to 5% of the applicable minimum production per year per hectare until the 20th year. If the holder cannot reach the minimum annual production by the first semester of the 20th year from the year in which the concessions were granted, the holder will be required to pay a penalty equivalent to 10% of the applicable minimum production per year per hectare until the 30th year. Finally, if the holder cannot reach the minimum annual production during the last stated period, the mining concessions will automatically expire.
The new legislation stipulates that title-holders of mining concessions that were granted before December 2008 will be obligated to pay the penalty as of 2019 if the title-holder didn´t reach either the Minimum Annual Production or made the Minimum Annual Investment in 2018.
Mining concessions will lapse automatically if any of the following events take place:
SRK Consulting (Peru) S.A. | May, 2022 |
SRK Consulting Peru SA SEC Technical Report Summary – El Brocal | Page 23 |
| ● | The annual fee is not paid for two consecutive years. |
| ● | The applicable penalty is not paid for two consecutive years. |
| ● | The Minimum Annual Production Target is not met within 30 years following the year after the concession was granted. |
Beneficiation concessions follow the same rules as those applicable to mining concessions. A fee must be paid that reflects the nominal capacity of the processing plant or level of production. Failure to pay such processing fees or fines for two years will result in the loss of the beneficiation concession.
Permits
In order to begin mineral exploration activities, a company is required to comply with the following requirements and obtain a resolution of approval from MINEM, as defined by Supreme Decree No. 020-2012-EM of 6 June 2012:
| ● | Resolution of approval of the Environmental Impact Statement |
| ● | Work program |
| ● | A statement from the concession holder indicating that it is owner of the surface land and in the case that it is not owner, it has authorization from the owners of the surface land to perform exploration activities |
| ● | Water License, Permission or Authorization to use water |
| ● | Mining concession titles |
| ● | A certificate of non-existence of archeological remains (CIRA) whereby the Ministry of Culture certifies that there are no monuments or remains within a project area. However, even with a CIRA, exploration companies can only undertake earth movement under the direct supervision of an onsite archeologist. |
Other Considerations
Producing mining companies must submit, and receive approval for, an environmental impact assessment that includes a social relations plan; certification that there are no archaeological remains in the area; and a draft of the mine closure plan. Closure plans must be accompanied by payment of a monetary guarantee.
In April 2012, Peru’s Government approved the Consulta Previa Law (prior consultation) and its regulations were approved by Supreme Decree Nº 001-2012-MC. These norms require prior consultation with any indigenous communities, as identified by the Ministry of Culture, before any infrastructure or projects, in particular mining and energy projects, are developed in the communities’ areas.
Mining companies must also obtain water rights from the National Water Authority and surface lands rights from individual landowners.
Encumbrances |
SRK has no knowledge of any material encumbrances that may affect the current resources or reserves as presented in this report. For more details on infrastructure modifications related to an expansion or development of the current Mineral Resource or reserve, please refer to Section 15 of this report.
SRK Consulting (Peru) S.A. | May, 2022 |
SRK Consulting Peru SA SEC Technical Report Summary – El Brocal | Page 24 |
Other Significant Factors and Risk |
SRK has no knowledge of any other significant factors or risks that may affect access, title, or the right or ability to perform work on the mineral property.
Royalties or Similar Interest |
SRK is not aware of royalty payments or similar payments beyond those established by Peruvian law for resource explotation.
SRK Consulting (Peru) S.A. | May, 2022 |
SRK Consulting Peru SA SEC Technical Report Summary – El Brocal | Page 25 |
Accessibility, Climate, Local Resources, Infrastructure and Physiography |
Topography, Elevation and Vegetation |
The Colquijirca mining unit is located at an average altitude of 4,300 MASL and is part of the high plains. Its topography is relatively gentle compared to the western and eastern mountain ranges. The mine is delimited by two sub-parallel valleys, named Ocshopampa and Andacancha, to the east and west of Marcapunta hill respectively. Other geomorphological features include pampas, creeks, summits, hills, and depressions (glacial cirques).
Regarding vegetation, there are two types of vegetation units in the area based on the vegetation cover map: wetlands and scrublands. However, these are scarce and are characterized by the sporadic presence of natural grasses such as ichu and tuber crops. Various plants such as totora reeds grow around lagoons and wetlands. (Territorio y Medio Ambiente S.A.C., 2019)
Means of Access |
The mining unit can be accessed via the following routes:
| ● | Lima – Casapalca – La Oroya – Cerro de Pasco – Colquijirca: 298 km (paved road) |
| ● | Lima – La Viuda – Canta – Huayllay – Colquijirca: 266 km |
Any of these routes can be covered in approximately six hours. The unit can also be accessed by air from Lima to Huanuco and then by land via the Huanuco - Chicrin paved road (approximately 81 km to the site).
Climate and Length of Operating Season |
Typical regional climatic conditions in the Colquijirca area, at altitudes between 4,180 and 4,435 MASL, are characterized by a very rainy and semi-frigid climate, with average annual rainfall of 1,207.7 mm and an average annual temperature that varies between 4.2 and 6.0 °C. The rainiest season is between January and March, corresponding to the summer season (wet season). The dry season (with less precipitation) runs from June to August. The average temperature for the evaluated area is 5.3 °C. The average relative humidity varies from 81.5% in August to 84.5% in March (Territorio y Medio Ambiente S.A.C., 2019).
Mining operations are carried out throughout the year.
Infrastructure Availability and Sources |
Natural water sources used by both the operations and the population come from the Angascancha and Pun Run lagoons. Water catchment from both lagoons is important given the high quality of captured resources. These waters are used continuously throughout the year.
El Brocal is aware that water from these lagoons belongs to the Peruvian State, which has issued the following resolutions through the National Water Authority (ANA):
| ● | Administrative Resolution No. 143-2011-ANA-ALA PASCO, which grants water use licenses for energy purposes. |
SRK Consulting (Peru) S.A. | May, 2022 |
SRK Consulting Peru SA SEC Technical Report Summary – El Brocal | Page 26 |
| ● | Administrative Resolution No. 001-2011-ANA-ALA PASCO, which grants water use licenses for population purposes. |
| ● | Administrative Resolution No. 002-2011-ANA-ALA PASCO, which grants water use licenses for metallurgical mining purposes. |
Electricity |
The electrical energy sources used are shown below:
Table 4-1: Electrical Energy Source
ELECTRICAL ENERGY SOURCE | ENERGY CONSUMPTION | |||
| In Kilowatt hours (kWh) | In Megajoules (MJ) | Percentage of use | |
Energy consumption by secondary sources | Purchase of energy from Empresa de Generación Eléctrica Huanza | 221,822,485 | 798,560,946 | 96.41% |
Energy consumption by primary sources | Energy produced by Central Hidroeléctrica Jupayragra | 4,205,247 | 15,138,892 | 1.83% |
| Energy produced by Central Hidroeléctrica Río Blanco | 4,058,447 | 14,610,410 | 1.76% |
| Total | 230,086,179 | | 100% |
Source: (El Brocal, 2020)
Personnel |
El Brocal has a recruitment, selection, and hiring policy: it seeks experienced and employees with experience in the mining industry to provide timely and practical solutions for different operational and support processes. These individuals must also be able to contribute to the fulfillment of strategic objectives. Most of the personnel working on the project live in the camp or in nearby communities. Skilled labor comes from different provinces of the region and from all over the country (El Brocal, 2020).
As of December 31, 2020, 3255 company and contractor employees are working at El Brocal. Direct employees are classified by type of contract, gender and professional category.
Table 4-2: Direct employees classified by type of hiring and gender
Type of contract | Gender | 2020 | 2019 | 2018 | 2017 | 2016 |
Fixed-term | Women Men | 6 2 | 7 4 | 17 21 | 16 318 | 25 315 |
Indefinite-term | Women Men | 27 627 | 32 645 | 175 551 | 14 434 | 32 423 |
Sub Total | Women Men | 33 629 | 39 649 | 192 572 | 30 752 | 57 738 |
Total | 662 | 688 | 764 | 782 | 795 | |
Source: (El Brocal, 2020)
Table 4-3: Direct employees classified by type of professional category
Professional category | Pasco | Men | Women | Total |
|---|---|---|---|---|
Management | 4 | 4 | | 4 |
Executives | 163 | 148 | 15 | 163 |
Employees | 175 | 168 | 7 | 175 |
Laborers | 311 | 307 | 4 | 311 |
Teachers | 9 | 2 | 7 | 9 |
Total | 662 | 629 | 33 | 662 |
Source: (El Brocal, 2020)
SRK Consulting (Peru) S.A. | May, 2022 |
SRK Consulting Peru SA SEC Technical Report Summary – El Brocal | Page 27 |
Supplies |
Supplies are readily available from established vendors and services from the local and regional communities and form Lima City.
Local suppliers refer to those located in Pasco Region. These include businesses owned by community members located within the area of direct influence (ADI) of the El Brocal Mine. Supply chain issues could be related to the blockage of the transport routes (Carretera central Highway), however the contingency plan provides alternative routes to the city of Lima (Lima-Canta-Huallay highway and Cañete-Lunahuana-Huancayo highway).
SRK Consulting (Peru) S.A. | May, 2022 |
SRK Consulting Peru SA SEC Technical Report Summary – El Brocal | Page 28 |
History |
The origins of the mining site in question date back to pre-Inca times. The Tinyahuarcos tribe extracted silver from the foot of the hill located in front of Puntac-Marca, which due to its abundance and quality was named GOLGUE (silver) and JIRCA (hill). Today, Colquijirca, translates into “silver hill".
Excerpted from (El Brocal, 2019).
In 1549, the Spaniards arrived in the area and began working in the Golguejirca mines. In 1880, the Colquijirca mine, owned by the Spanish citizen Manuel Clotet, was ceded to his son-in-law, Eulogio Fernandini, who in 1886 began work on the main Colquijirca tunnel (mining underground work) cavern, which was later called the "Socavón Fernandini". The execution of this 900-meter-long work took 13 years when finally, silver, lead and zinc veins were eventually discovered.
In 1889, the Huaraucaca Smelter was installed to produce silver bars; engineer Antenor Rizo Patrón was in charge of overseeing installation and subsequent management of the smelter. In 1921, the smelter and replace it with a flotation plant located at the same site.
On May 7, 1956, the mining operation was registered as "Sociedad Minera El Brocal S.A.". In 1973, work began on the "Mercedes-Chocayoc" open pit, while in the Marcapunta area, underground mining was carried out. In 1974, conventional underground mining ceased and open pit stripping was intensified; this led production to increase by 580 MTD and later, by 1,000 MTD.
Between 1980 and 1981, activities in the open pit increased to produce 1,500 MTD of ore. In 1990 and 1991, 1,750 MTD and 2,000 MTD of ore were treated, respectively, from the Principal and Mercedes-Chocayoc pits.
In 1994, an aggressive exploration program began through diamond drilling, which allowed the company to identify and quantify San Gregorio and Marcapunta Projects.
In November 1996, the Huaraucaca concentrator plant launched processes for selective flotation of zinc, silver and lead. This year, production reached 2,200 MTD. In 2007, the installed capacity of the Huaraucaca concentrator plant was 5,500 MTD.
After the Board of Directors approved an expansion program in August 2008, ore production capacity was ramped up to 18,000 MTD in 2009 and by 2014, Plant 1 produced 7,000 MTD and Plant 2: 11,000 MTD with an installed capacity of 18,000 tonnes per day.
Background
The Colquijirca Mining District has been studied by many national and international geologists who, as more geological data has become available, have postulated different genetic models to estimate its economic potential.
This district has a long productive history: Ag (Au) ore was mined in pre-Inca, Inca, and colonial times. During the first half of the 20th century, the area became an important producer of Ag and Bi and is currently one of the largest producers of Zn-Pb-Ag and Cu (Au).
In 1994, Geoterrex carried out a geophysical campaign in Colquijirca, Marcapunta and San Gregorio, delimiting two geophysical anomalies in Marcapunta and two others in San Gregorio. The geophysical methods used included electromagnetism (Time Domain EM), gravimetry and induced polarization.
SRK Consulting (Peru) S.A. | May, 2022 |
SRK Consulting Peru SA SEC Technical Report Summary – El Brocal | Page 29 |
A last geophysical campaign was carried out by Geoterrex in 1995, including Gravimetry and Induced Polarization works, which corrected a false anomaly in the northern sector of San Gregorio and confirmed the first anomaly. Two other anomalies were confirmed: Marcapunta Norte and Marcapunta Oeste.
From 2005 to 2007 an aggressive diamond drilling campaign was carried out at Marcapunta Norte, on the geophysical anomalies carried out in 1994 and 1995. Around 30,000 meters of diamond drilling were carried out, making a total of 110 drillholes, with the purpose of increase Mineral Resources and the certainty of existing resources.
At the beginning of 2008, underground operations restarted at the Marcapunta Norte Mine; 1000 MTD of copper ore were produced through the Room and Pillar mining method.
Currently, exploitation at the Marcapunta Mine has increased significantly and now produces 8,000 MTD of copper ore through a Sub Level Stopping method.
SRK Consulting (Peru) S.A. | May, 2022 |
SRK Consulting Peru SA SEC Technical Report Summary – El Brocal | Page 30 |
Geological Setting, Mineralization, and Deposit |
Regional, Local and Property Geology |
The Colquijirca mining unit is located within the Cerro de Pasco (22-k) quadrangle. Its regional geology is predominantly made up of lithostratigraphic units corresponding to Excelsior Group, Mitu Group, Pucará Group, Chambará Formation and Pocobamba Formation - Calera Formation, and igneous rocks in the form of batholiths, subvolcanic stocks, domes and diatremes (Figure 6-1). All igneous bodies have been emplaced at different ages, but can be grouped into 6 events: Carboniferous, Upper Permian - Lower Triassic, Eocene, Oligocene, Lower Miocene and Upper Miocene (Figure 6-2). Sedimentary, volcanic and intrusive rocks are covered by Quaternary deposits of diverse origin, nature, thickness and propagation. The Colquijirca mine area, according to Cobbing's geotechnical schematization, is in the "Western Peruvian Basin", which was affected by several tectonic phases (El Brocal, 2021) .
Volcanic activity began approximately 14.13 Ma ago (Bissig et al., 2008). Then, between 12.4 and 12.7 Ma (Bendezú & Fontboté, 2002) marks the highest volcanic activity in Marcapunta, with the emplacement of dacitic domes, followed by polymetallic mineralization between 11.6 and 10.5 Ma; finally, the resurgent Montura dome occurs after 10.5 Ma (INGEMMET, 2011) .
The Marcapunta volcanic complex is located between the San Juan fault and the Cerro de Pasco fault, both of N-S direction, which controlled the emplacement of Cerro de Pasco and Yanamate domes. The northern edge of the Marcapunta Volcanic Complex is in contact with the Calera Formation of the Eocene-Oligocene, which is the host rock of mineralization in Colquijirca mine; the southern edge is in contact with the western facies of Pucará Group (Ángeles, 1999; Bendezú & Fontboté, 2002; Bendezú, 2007; Sarmiento, 2004); and the eastern and western edges are covered by Quaternary material (INGEMMET, 2011) .
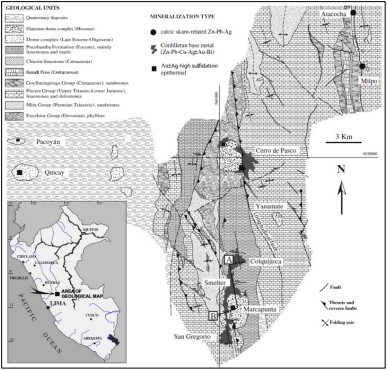
Figure 6-1: Geology and main mining centers in the Cerro de Pasco sector, central Andes of Peru.
Source: (Bendezú, Page, Spikings, Pecskay, & Fonboté, 2008)
SRK Consulting (Peru) S.A. | May, 2022 |
SRK Consulting Peru SA SEC Technical Report Summary – El Brocal | Page 31 |
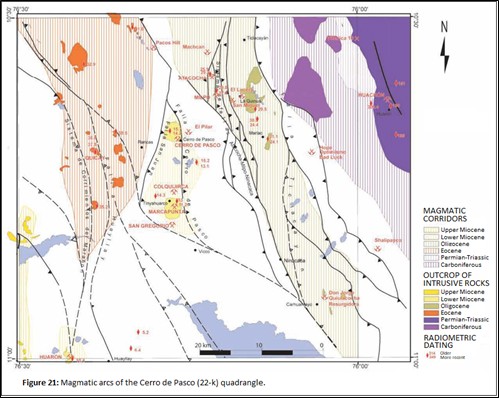
Figure 6-2: Magmatic arcs of the Cerro de Pasco (22-k) quadrangle.
Source: (INGEMMET, 2011)
Local Geology |
Excerpted from (El Brocal, 2021)
The Colquijirca mining district is located on rocks belonging to the Excelsior Group phyllites, sandstones and red conglomerates of the Mitu Group, followed by marine limestones of the Pucara Group, and towards the top, conglomerates and continental facies of carbonate breccias of the Calera Formation of Eocene-Oligocene age. These units are intruded by the middle Miocene (11.5 ± 0.4 Ma) Marcapunta volcanic complex.
Metamorphic rocks |
Excelsior Group (SD-e)
These are the oldest rocks, from the Lower to Middle Devonian, which exist near the mine area and are called "Excelsior Series" Mc Laughlin (1924). These formations are composed of gray to greenish-gray shales and phyllites with abundant intercalations of quartzites in thin beds. They contain some levels with oblique lamination, of decimetric scale as well as pluricentimetric slump folds.
These rocks are restricted to the heart of the Cerro de Pasco anticline. Their thickness is greater than 300 m.
SRK Consulting (Peru) S.A. | May, 2022 |
SRK Consulting Peru SA SEC Technical Report Summary – El Brocal | Page 32 |
Sedimentary Rocks |
Mitu Group (Ps-m)
unit outcrops locally and discontinuously to the west of the mine, mainly on both margins of Andacancha creek, but also appearing south of Marcapunta hill.
Near Andacancha creek, the rocks of this group are made up of two sequences. the first sequence is made up of polymictic conglomerates with particles and sub-angular fragments that are cemented by a fine-grained sandstone matrix, which is brick red in color and found in medium to thick strata with cross bedding and levels of fine sandstones; the thickness of the sequence cannot be defined.
In this area, the volcanic sequence is absent; according to the reviewed bibliography, this type of sequence is scarce in the western part of Cerro de Pasco.
The Mitu Group probably rests on the rocks of the Excelsior Group in unconformity and is also unconformably below the rocks of Pucará Group. Its thickness in the area is greater than ten meters.
Pucará Group or Western Pucará (TrJ-p)
This unit corresponds to undivided limestone rocks, which in the Project area are found with certain continuity in the hills west of the Colquijirca mine; outcrops are visible on both margins of the San Juan River valley, from Sacrafamilia to Huaraucaca.
The rocks correspond to grayish limestones that present a smooth to undulating morphology in the area, with some karsts and, on rare occasions, with dolines.
Chambará Formation or Eastern Pucará (Tr-ch)
This unit is part of the Pucará group, mainly located in the Alma Huanusha hill, where limestones outcrop in a monotonous and massive form, bluish gray when fresh and creamy gray when weathered; the limestones include irregularly shaped chert.
The contact of Chambará limestones with Mitu Group rocks is unconformable.
Pocobamba Formation (KT-po)
It is made up of three members:
| ● | Caucan: Constituted by silty claystones that grades to limonites, red in color and sandstones with conglomeratic breccias, which are found in a calcareous cement. |
| ● | Shuco: Corresponds to breccias made up of limestone clasts of subrounded to subangular shapes and some sparse lenses or levels of limolitic sandstones. |
| ● | Calera or Calera Formation |
Calera Formation (P-ca)
It is made up of marly dolomites, claystones with marls and limestones with abundant chert, followed by intercalations of claystones and marly limestones with micritic nodules, ostracoids, bioclasts and rhizomorphs; in Colquijirca, in North Pit, it is 220 m thick and contains mineralization mantles currently being exploited. Its composition is dominated by carbonate rocks with limestone and, to a lesser extent, marl and siliceous rocks (Chert). There are also thin intercalations of silty clays strata and eventually tuffs in this member. This unit corresponds to the Eocene period; on
SRK Consulting (Peru) S.A. | May, 2022 |
SRK Consulting Peru SA SEC Technical Report Summary – El Brocal | Page 33 |
the surface, it outcrops in a localized form, as it is deformed and covered by Quaternary deposits. Ángeles (1992) divides this sequence into 3 stratigraphic units:
| ● | Lower Calera: This unit concordantly and progressively overlies the Shuco Formation and in some places their separation is not distinguishable; it outcrops along Marcapunta Norte and Colquijirca (diamond drillholes and pit). A model column indicates, towards the footwall, detrital sediments, thick and thin packages of Pucara pebble conglomerates, of calcareous matrix intercalated with levels of rhyolitic tuffs that continues with a sequence of volcano sedimentary sediments with lithic clasts of different granulometry included in a calcareous matrix and towards the top, ends with a sequence of gray mudstone limestones with little pyroclastic influence. This facies indicates a playa lake evolution with an abundant contribution of detrital material (fluvial-volcanic) (Ángeles 1993). It presents a thickness of approximately 64 to 80 m. |
| ● | Middle Calera: This unit concordantly overlies the lower horizon and is characterized by facies of mudstone, wackestone to grainstone limestones with concretionary structures, bioturbation and rhizomorphs, which are gray in color and intercalated with thin levels of marls, silty clays, argillites and isolated stretches of gray tuffs. This facies assemblage indicates a shallow lake probably holomictic (Ángeles 1993). It presents a thickness ranging from 106 m (Tajo Principal) to 55 m (La Calera). |
| ● | Upper Calera: This unit concordantly overlies the middle horizon, it is characterized by a succession of limestones and gray marls with a strong level of gray tuff, thin stretches of silty clays and claystones. The calcareous horizons are massive, of gray and brownish colors, of mudstone and wackestone textures with pressure microstructures (stylolites); the marly and silty clay horizons exhibit various shades of gray and are intercalated as thin strata. In the Colquijirca sector, the top of this horizon cannot be observed, so we estimate a thickness of 44 m. The observed facies suggest a lacustrine sedimentation environment with an isolated distal pyroclastic event (Ángeles 1993). |
Volcanic Rocks |
Marcapunta Volcanic Center (Mi)
The volcanic apparatus itself is essentially constituted by two lithological units (Vidal, 1984). The earlier one, the "Unish tuffs", is composed of pyroclastics and lavas. The later one is characterized by dacitic to quartz-latite lava domes, which are collectively referred to as the "Marcapunta intrusive". Vidal et, al. dated the lava domes at 11.5 ± 0.4 Ma, and the hydrothermal activity at 10.8 ± 0.3 Ma.
Intrusive rocks |
Intrusive rocks occurring in the mine area belong to a stock-type intrusive body of dacitic composition, of hypabyssal nature, which is related to the origin of the hydrothermal deposit.
In the Marcapunta hill, pyroclasts and lavas are affected or intruded by a dome of dacites and quartz latites, causing marginal breccias in the South and North ends known as Marcapunta and San Gregorio.
The breccias are made up of mixtures of clasts from the sedimentary and metamorphic basement block and have an igneous matrix.
The igneous activity in Marcapunta hill evolved from a pyroclastic extrusive phase to a phase of endogenous lava-domes, at the end of which the marginal breccias would have formed. The lower eastern part of the hill is constituted by the intrusive body, however, the distribution of volcanic and intrusive rocks in the body of the hill are not well defined and rocks are very altered and covered by cover materials.
SRK Consulting (Peru) S.A. | May, 2022 |
SRK Consulting Peru SA SEC Technical Report Summary – El Brocal | Page 34 |
Quaternary Deposits (Q) |
Covering the rock units described above are the Quaternary deposits described below:
Glacial Deposits (Q-gl)
These materials correspond to materials resulting from the ablation of ice on rocks; they are predominantly constituted by a poorly graded mixture of silts or sandy clays with gravels and varying percentages of rock fragments of different sizes. The grains and particles vary from sub angular to sub rounded, and the lithological composition of the grains and clasts vary according to the place, depending on the proximity to outcropping rocks. Fines content varies from slightly to moderately plastic, ranging from compact to moderately compact. Their thickness is very variable from place to place.
In the mine area, these deposits are found as cover of the described units and their thicknesses are not relevant; outside the mine they still preserve their original forms of deposition in the form of moraines.
Fluvio-glacial Deposits (Q-fg)
These deposits have suffered some removal by rainfall and portion of their components have been eroded and/or saturated by water.
Their composition is dominated by sands and gravels, including silts and some rock fragments. They are generally found with a certain continuity in the creek areas, where they reach their greatest thickness; these materials are found in the Andacancha and Buena Vista creeks and in the vicinity of Colquijirca river, which runs near Cerro Marcapunta.
Alluvial Deposits (Q-al)
These are materials transported and accumulated by the waters of the main flows such as the San Juan and Colquijirca rivers; they are made up of sand, gravel, pebbles and present some boulders and fines; these materials are generally poorly graded, with predominantly subrounded to rounded shapes and a lithological composition made up mostly of limestone, sandstone and a small percentage of igneous rocks.
These deposits are several meters thick and saturated near the creeks and San Juan River. Alluvial deposits are part of the alluvial plain of San Juan River from Huaraucaca to San Gregorio, they can be used as aggregate quarry.
Wetland Deposits (Q-bo)
These deposits are found at the bottom of some creeks, as well as in the contours or areas adjacent to lakes. They are also found in localized form in some gently inclined slopes, where drainage is poor or permanent water outcrops are present and the sandy-gravelly-silty soils contain high mountain hydrophytic vegetation with variable organic matter content, which is dark gray to grayish-brown color.
Colluvial Deposits (Q-co)
These deposits are configured with materials from debris from old and/or recent slopes; they are made up of a mixture of rock fragments of different sizes with or without fine matrixes and range from somewhat dense to loose with particles and grains that are predominantly angular shape. In the mine area, they are located in some places on the flanks of Cerro Marcapunta and in the upper parts of the hill range; in these places, they occur almost continuously and are mainly in calcareous rocks.
SRK Consulting (Peru) S.A. | May, 2022 |
SRK Consulting Peru SA SEC Technical Report Summary – El Brocal | Page 35 |
North Pit

Figure 6-3: Geologic map of the Colquijirca Mining District, showing the sectors: Tajo Norte, Tajo Sur and Marcapunta.
Source: Carlos Ángeles, 1993 (El Brocal, 2021)
Structural Context |
Excerpted from (El Brocal, 2021)
SRK Consulting (Peru) S.A. | May, 2022 |
SRK Consulting Peru SA SEC Technical Report Summary – El Brocal | Page 36 |
In the Colquijirca area, there are three longitudinal faults: Huachuacaja (with apparent strike-slip displacement); Cerro de Pasco (corresponding to a N-S striking reverse fault); and a third, which follows the axial plane of the Mercedes-Chocáyoc anticline and marked by an apparent displacement of the east block to the south (Figure 6-3). The sedimentary strata are strongly folded, giving rise to the presence of anticlines and synclines. The fold axes have an NNW strike and a gentle dip of the axis to the south.
The most prominent lineaments in the district are two major regional north-south reverse faults, north-south fold trends and a slip fault system. These include the major north-trending longitudinal fault; a reverse fault, which passes through or near Cerro de Pasco and Marcapunta volcanic centers; and basin morphology controlled during sedimentation of the Pucará and Calera Formation. A second reverse fault of the pre-Marcapunta complex with NNW-SSE to north-south direction passes west of the Colquijirca-Smelter deposits and emerges south of the volcanic complex. Most of these structural elements are related to Neogene compression events that affected extensive areas of the central and northern Peruvian Andes (Ángeles, 1999).
Property Geology |
Excerpted from El Brocal, 2021
Due to the advance of stoping over the years, the Colquijirca deposit is currently exposed, which facilitates the geological identification of the Tertiary basin. Asymmetric anticlines and synclines composed of carbonate and detrital rocks, attributed to the Eocene-Oligocene Calera Formation, can be found and considered as the host of mineralization. The deposit also presents volcano-clastic intercalations (ash tuffs), which is evidence of volcanic activity that was contemporaneous to sedimentation. In addition, with the review of 5 drillholes, the Shuco conglomerate sequence of the upper Eocene has been identified in depth, which underlies Lower Calera and overlies in depositional contact with the Mitú sandstones of the Permian-Triassic (Megard, 1978). To the south, at Smelter and Marcapunta, the sequence is uplifted and intruded by domes and dykes of dacitic composition due to the diatreme, which shows strong advanced argillic alteration and is recognized as the focus of mineralization in the mining district.
The Marcapunta diatreme-dome complex, which is exposed in the center of the Colquijirca district (Sillitoe 2000; Bendezú et al. 2003; Sarmiento 2004), is one of a series of Miocene volcanic edifices, including Cerro de Pasco and Yanamate (Figure 6-4). It consists of multiple lava-dome intrusions of mainly dacitic composition. Injection and explosion breccias and pyroclastic layers, typical of diatreme conduits, are widely recognized at depth. The inward-dipping normal fault, located in peripheral areas suggests that the entire edifice collapsed, probably before the main mineralization episodes (Bendezú et al. 2003).
SRK Consulting (Peru) S.A. | May, 2022 |
SRK Consulting Peru SA SEC Technical Report Summary – El Brocal | Page 37 |
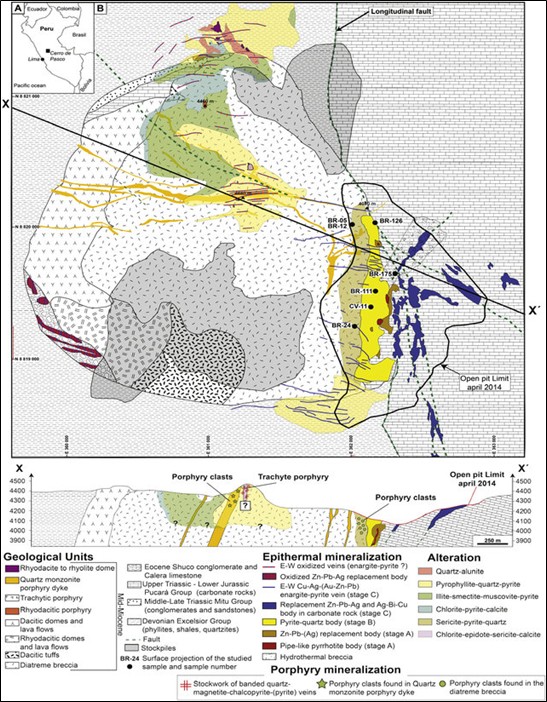
Figure 6-4: Geologic map of the diatreme-dome complex at Cerro de Pasco
Source: Compiled from Rogers (1983) and Huanqui (1994). (Baumgartner, Fontboté, & Vennemann, 2007)
SRK Consulting (Peru) S.A. | May, 2022 |
SRK Consulting Peru SA SEC Technical Report Summary – El Brocal | Page 38 |

SRK Consulting (Peru) S. A. | May, 2022 |
SRK Consulting Peru SA SEC Technical Report Summary – El Brocal | Page 39 |
Structural Geology |
Excerpted from (Ventura, 2020)
Structurally, the Tertiary basin composed of the Shuco conglomerate, and the Calera Formation has been controlled by the Major Longitudinal Fault located east of the Tajo; Ángeles (1993) considered a thick active transtensional thrust sheet that controlled marine and continental sedimentary deposition since the Triassic (Pucará Group), generating thrusting, graben and horst in time. Therefore, it is inferred that during one of these tectonic events the Pucará was uplifted and eroded, and that later in the Eocene it was filled by deposits of alluvial and fluvial fans and calcareous-detrital lacustrine sediments of the Pocobamba and Calera Formation, overlying the Mitu in erosional unconformity. Theedimentary sequence was later affected by the comprehensive tectonics of the Upper Oligocene and Lower Miocene (22.5 ma,) generating folding and giving rise to the asymmetric anticlines and synclines recognized in the Tajo with a NNW trend and with greater compression to the north; inverse faults subparallel to the bedding and low-angle faults with slight overthrusting (thrusting) of the limestones of Middle Calera recognized in Flanco la Pampa are identified as well as small asymmetric and overturned folds (Figure 6‑6). Very locally, trans-Andean faults are identified with no infill except calcite crystals, but with dextral movement striations without major displacement, as well as E-W faults (reactivated, last phase) infilled with gouge with sinistral movement striations that displace in a stepwise manner <1m.
The Major Longitudinal Fault has been recognized near Cerro de Pasco with N165 orientation and 65°E dip where it contacts the Eastern Pucara with the Pocobamba Formation. Ángeles, 1993.
The main longitudinal faults in the mine area have axes almost parallel to the axis of the folds; there are also overthrusting faults and local normal faults (El Brocal, 2021). Structurally, El Brocal mining unit presents two main systems: The Andean trend system, N15º-45ºW and N45º-60ºE. The latter are late manifestations of local tectonics that show a dislocation in structural blocks generating horst and grabens that expose contrasting levels of adjacent blocks. Figure 6-6 shows a geologic and structural map of North Pit - Marcapunta.
SRK Consulting (Peru) S. A. | May, 2022 |
SRK Consulting Peru SA SEC Technical Report Summary – El Brocal | Page 40 |

SRK Consulting (Peru) S. A. | May, 2022 |
SRK Consulting Peru SA SEC Technical Report Summary – El Brocal | Page 41 |
Alteration |
Excerpted from Bendezú et al., 2008
The generalized alteration of almost all the diatreme-dome complex consists of quartz - alunite - dickite - kaolinite ± (pyrophyllite - zunyite - illite) assemblages in mineralized areas and kaolinite - illite ± (smectite) - sericite - chlorite - calcite outside the mineralized area.
The Marcapunta volcanic complex has been strongly altered to form residual quartz cores, locally vuggy, with advanced argillic alteration halos composed mainly of quartz-alunite and kaolinite assemblages. Gold and silver, which present mainly in veins and oxide coatings, are largely contained within these vuggy quartz cores, which extend into the adjacent country rock.
The vuggy silica is divided into quartz-alunite and argillic alteration zones, which affects most of the Marcapunta volcanic rocks. In several areas, quartz-alunite alteration is observed to post-date Au-(Ag)-bearing veins, suggesting that several repeated episodes of silica-quartz-alunite vuggy alteration and Au-(Ag) deposition took place at Marcapunta.
Mineralization |
The district hosts two main types of epithermal mineralization: (1) disseminated high-sulfidation Au–(Ag) mineralization, hosted by volcanic rocks from the Marcapunta complex, and (2) sulfide-rich Cordilleran polymetallic deposits hosted in the carbonate rocks of both the Pucará Group and the Pocobamba Formation (Figure 6‑8).
High sulfidation Au-(Ag) epithermal. |
Mineralization consists of oxide veinlets and disseminations hosted in vuggy silica. Typical gold and silver concentrations in vuggy silica are on the order of 0.2-3 and 10-70 g/t, respectively (Vidal et al. 1997) and Ag/Au ratios vary from 10 to 30.
The deep parts of the vuggy silica contain unoxidized Au- (Ag) minerals, which are composed of less than 5% of disseminated sulfides by volume, and sulfide veins composed mainly of pyrite-enargite, chalcocite, covellite and sphalerite with the presence of clays, mainly kaolinite, but also smectite and/or illite. The vuggy silica and surrounding quartz-alunite zones, which do not have veinlets, contain minor amounts of Au-(Ag), suggesting that most of the precious metals precipitated during veinlet formation.
Cordilleran Epithermal |
A significant feature is the high total sulfide content, which fluctuates between an average 30 and 50% of the volume on average. The most abundant minerals are pyrite, which crystallized during an early silica-pyrite stage, followed by enargite-pyrite and, finally, late-stage chalcocite (Bendezú 2007). The strongly oxidized zones, originally composed of enargite-pyrite, show Ag/Au ratios ranging from 80 to 120, much higher than those found in the Au-(Ag) minerals disseminated throughout Oro Marcapunta (10 to 20). Another important characteristic of the Cordilleran type mineralization in the Colquijirca district is the mineralogical zoning:
1) | A Cu- (Au - Ag) core dominated by enargite and generally accompanied by alunite assemblages. |
2) | An intermediate Cu- (Zn - Pb - Ag - Bi) zone dominated by chalcopyrite, sphalerite and galena; and |
3) | An external Zn - Pb- (Ag) envelope composed mainly of sphalerite and galena. |
SRK Consulting (Peru) S. A. | May, 2022 |
SRK Consulting Peru SA SEC Technical Report Summary – El Brocal | Page 42 |
Cordilleran veins systematically cut the precious metal veins in the easternmost part of the Marcapunta Oeste project. The quartz-alunite zones developed during the high sulfidation epithermal event contain Au (Ag) veins, which were cut by pyrite-rich veinlets (enargite) generated during the Cordilleran event. In addition, most of the cavities within the vuggy silica contain intergranular enargite fillings from the Cordilleran stage, which in part destroy earlier Au-(Ag) veinlets with quartz-alunite assemblages.
Another characteristic noted below for Colquijirca is that Cordilleran-type ores show notably higher Ag / Au ratios than high-sulfidation epithermal Au-(Ag) mineralization.

Figure 6-7: Alunite samples from the Colquijirca zone.
(A) Transmitted light micro-photograph of sample PBR-336 showing alunite in the Marcapunta high sulfidation epithermal gold mineralization.
(B) Photograph of an outcrop in southern Marcapunta where plumose alunite (sample PBR-273) cements Au-(Ag) with rounded clasts (up to 2 ppm Au) of vuggy silica formed from the epithermal system.
(C) Small geode showing euhedral alunite intergrown with enargite and small amounts of pyrophyllite and pyrite, Cordilleran ore from Smelter (sample PBR-322).
(D) Photograph showing the effect of Cordilleran mineralization on volcanic rocks. A void left by former sanidine is filled by laminated euhedral alunite intergrown with quartz, pyrite and enargite; the latter two are also found as veinlets and as coatings in cavities.
(E) Intimate intergrowth between alunite and sphalerite revealed by backscattered electron imaging of sample PBR-298 from the Cordilleran Colquijirca deposit.
(F) Backscattered electron imaging of PBR-208 sample showing the typical extremely fine-grained habit of alunite from the large Cordilleran San Gregorio deposit.
Source: (Bendezú, Page, Spikings, Pecskay, & Fonboté, 2008)
SRK Consulting (Peru) S. A. | May, 2022 |
SRK Consulting Peru SA SEC Technical Report Summary – El Brocal | Page 43 |
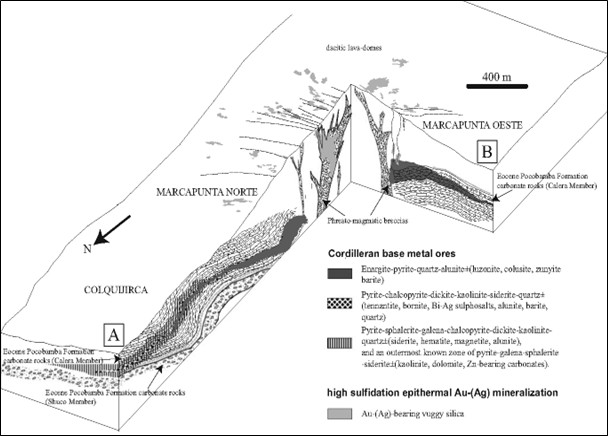
Figure 6-8: Block diagram illustrating the spatial relationships between the Oro Marcapunta high sulfidation epithermal Au-(Ag) mineralization and the Marcapunta Oeste, Smelter and Colquijirca Cordilleran base metal deposits
Source: (Bendezú, Page, Spikings, Pecskay, & Fonboté, 2008)
SRK Consulting (Peru) S. A. | May, 2022 |
SRK Consulting Peru SA SEC Technical Report Summary – El Brocal | Page 44 |
Excerpted from El Brocal, 2021
The Colquijirca deposit exposes three zones. The deepest part of the southwest sector of North Pit shows a core of tubular shape, which is essentially constituted by enargite plus variable amounts of pyrite and quartz. This core has an envelope composed of chalcopyrite and variable amounts of tennantite, in addition to sphalerite and galena. In turn, this envelope is surrounded by a relatively extensive zone composed of sphalerite and galena. This last zone, whose largest extension is towards the north of the district, constitutes the bulk of the Colquijirca deposit (North Pit) currently in exploitation (Figure 6-9). To the south of North Pit, the enargite core extends for more than 2 km becoming thicker and wider as it approaches the Marcapunta volcanic complex.
The sector called Marcapunta Norte, located immediately south of North Pit, is the extension of the Colquijirca deposit. This sector is composed of two internal zones: The first is composed of enargite and that the second of polymetallic nature, i.e., of chalcopyrite, tenantite, sphalerite and galena. Unlike sectors located further south, the Marcapunta Norte sector is characterized by the fact that it has undergone a process of supergene enrichment. This process has generated chalcocite bodies, which have been superimposed to the enargite zone and to a lesser degree, to the polymetallic zone composed of chalcopyrite, tenantite, sphalerite and galena; this formed a sector of relative mineralogical complexity, especially in terms of intergrowths.
The mineralized structure of the Central Upper Mantle is hosted in carbonate rocks of the Middle Member of Calera Formation and has a sub-horizontal stratiform geometry of N160° strike and 06N dip. The structure has an approximate length of 520m, a width of 270 m and an average thickness of 21 m. The occurrence of structures secant to the bedding, such as breccia bodies and veins, is less common.
Mineralogically, the Central Upper Mantle consists essentially of enargite, accompanied by variable amounts of pyrite. Less important phases include luzonite, colusite and an even small quantity of occurrences of chalcocite, tenantite, ferberite and bismuthinite.
The Central Upper Mantle contains enargite-luzonite (Cu3AsS4) with grades varying between 1 and 3% Cu and 0.3 and 1% As. Ag contents vary between 15 and 30 g/t. Some internal sectors of the Central Upper Mantle show gold values between 0.3 and 0.7 g/t. Gangue minerals include quartz, alunite, zunyite and clays, mainly kaolinite, dickite, illite and smectite.
SRK Consulting (Peru) S. A. | May, 2022 |
SRK Consulting Peru SA SEC Technical Report Summary – El Brocal | Page 45 |

Figure 6-9: Mineralogy of Colquijirca deposit.
Source: (El Brocal, 2021)
Temporal evolution of mineralization at Colquijirca |
Magmatic activity in the Cerro de Pasco area (between 15.4 and 15.1 Ma) was characterized by successive intrusions of diatremes, dacitic domes and quartz-monzonite dykes (Baumgartner, Fontboté, & Vennemann, 2007).
The temporal evolution of mineralization at Colquijirca consists mainly of two stages:
| ● | The first stage of mineralization was formed from a moderate salinity fluid formed by the mixture of magmatic water (end-member salinity ~ 10% wt NaCl) and meteoric water. According to Lacy (1949), in the paragenetic sequence of the first stage of mineralization, pyrite generations are found (See Figure 6-10). |
| ● | Figure 6-11 shows the paragenetic sequence of the second stage (between 15.5 and 14.4 Ma, Baumgartner et al.,2007)), in case of Cordilleran base metal replacement ore bodies. |
| ● | Figure 6-12 shows the paragenetic sequence of the second stage, in case of diatreme breccia-hosted veins. |
SRK Consulting (Peru) S. A. | May, 2022 |
SRK Consulting Peru SA SEC Technical Report Summary – El Brocal | Page 46 |

Figure 6-10: Paragenetic sequence for the first stage of mineralization (including observations by Bowditch 1935, Lacy 1949, and Einaudi 1968, 1977).
Source: (Baumgartner, Fontboté, & Vennemann, 2007)
SRK Consulting (Peru) S. A. | May, 2022 |
SRK Consulting Peru SA SEC Technical Report Summary – El Brocal | Page 47 |

Figure 6-11: Paragenetic sequence of Cordilleran base metal replacement ore bodies.
Source: (Baumgartner, Fontboté, & Vennemann, 2007)
SRK Consulting (Peru) S. A. | May, 2022 |
SRK Consulting Peru SA SEC Technical Report Summary – El Brocal | Page 48 |

Figure 6-12: Paragenetic sequence of second-stage veins hosted in the diatreme breccia.
Source: (Baumgartner, Fontboté, & Vennemann, 2007)
Deposit Type |
The mineral deposits of the Colquijirca district belong to a member of the family of porphyry copper (Cu) related deposits known as Cordilleran deposits. These types of deposits, which are generally formed in the upper parts of a porphyry Cu, are fundamentally characterized by prominent zoning with internal parts that are dominated by Cu and external zones where Zn, Pb and Ag are the main economically-interesting elements. In the case of the Colquijirca district, and specifically the area between the Marcapunta Norte and Colquijirca sectors, such zoning generally consists of three zones, which mineralogically consist mainly of enargite in the internal parts; chalcopyrite in the intermediate parts; and sphalerite and galena in the external parts (El Brocal, 2021).
Cordilleran Deposits |
Excerpted from Baumgartner et al., 2007
SRK Consulting (Peru) S. A. | May, 2022 |
SRK Consulting Peru SA SEC Technical Report Summary – El Brocal | Page 49 |
Cordilleran deposits have also been referred to as Butte-type vein deposits (Meyer et al. 1968), polymetallic veins and, recently, zoned base metal veins (Einaudi et al. 2003).
The term Cordilleran deposit was introduced by Sawkins (1972) and subsequently used by Einaudi (1982), Guilbert and Park (1985), Bartos (1987), Macfarlane and Petersen (1990), Hemley and Hunt (1992), Bendezú and Fontboté (2002), Bendezú et al. (2003) and Bendezú (2007) and Baumgartner (2007). The main characteristics of the Cordilleran base metal deposits can be summarized as follows (modified from Sawkins 1972 and Einaudi 1982):
1) | Close association in time and space with calc-alkaline igneous activity, i.e., the same environment as most porphyry Cu and high sulfidation epithermals. Au - Ag deposits; |
2) | "Late" deposit in the evolution of the porphyry system (as seen in the abundant cross-cutting relationships and sparse geochronological data subsequent to high sulfidation Au (-Ag), skarn and porphyry Cu deposits). |
3) | Deposition mainly under epithermal conditions at shallow levels below paleosurface; |
4) | Cu - Zn - Pb- (Ag - Au - Bi) metal assemblages, very rich in sulfides (up to more than 50% by weight of total sulfides); |
5) | Frequently, but not always, well-developed zoning of ore and alteration minerals, cores may show high sulfidation and, although commonly this is not the case (see below), advanced argillic alteration assemblages; |
6) | Frequent early pyrite-quartz stages with low sulfidation assemblages containing pyrrhotite-(arsenopyrite) that can be extensive and form large bodies zoned towards Zn-Pb minerals;Occurs mainly as open space filling (veins, breccia bodies) in silicate host rocks and as replacements in carbonate rocks. |

Figure 6-13: Schematic cross section of the Colquijirca district showing the spatial and temporal distribution of the different deposit types
Source: (Bendezú & Fontboté, 2002)
Excerpted from Bendezú, Fontboté, & Cosca, 2003
In the Colquijirca district, the relative sequence of events and the absolute ages obtained establish that Cordilleran base metal lode and replacements ores, which are mainly epithermal and formed
SRK Consulting (Peru) S. A. | May, 2022 |
SRK Consulting Peru SA SEC Technical Report Summary – El Brocal | Page 50 |
at high-sulfidation and oxidations states, were emplaced considerably later (~460,000 years) than the Au–(Ag) high-sulfidation epithermal mineralization
Many classic districts known for their epithermal porphyry copper and/or Au- (Ag) deposits may host concentrations of "Cordilleran base metal veins" at any spatial position upward from the porphyry environment. These may occur at levels as shallow as the epithermal environment, which in carbonate rocks may be characterized by fine-grained Zn-Pb mineralization.
SRK Consulting (Peru) S. A. | May, 2022 |
SRK Consulting Peru SA SEC Technical Report Summary – El Brocal | Page 51 |
Exploration |
Marcapunta Sur Oeste and San Gregorio are the most important exploration projects. The Marcapunta Sur Oeste project is a deposit of Cu-Au-As; it is constituted by horizontal to sub-horizontal mantles and by irregular bodies of breccias, confined in a prospective horizon, whose thickness varies between 20 m and 100 m. It is located between the Mitu Group sediments at the base, and the dacitic volcanic rocks at the top (El Brocal, 2019)
Until 2012, several exploration campaigns were conducted, representing a total of 3,837m of underground workings. Of these, 2,180m are access workings (ramp), 1,657m are exploration drifts.
Exploration Work (Other Than Drilling) |
For the purposes of this report and resource and reserve estimates, in SRK’s opinion, active mining, exploration drilling, and in-pit mapping provide the most relevant and robust exploration data for the current Mineral Resources estimation.
Geological Mapping |
Excerpted from (Ventura, 2020)
In 2020, a geological review of the Colquijirca pit was conducted. This geological mapping covered 143 hectares and was carried out at a scale of 1:1000. In addition, 5 diamond drill holes located in the Colquijirca, Smelter and Marcapunta pits were surveyed to prepare stratigraphic columns. The plan generated from geological mapping is shown in Chapter 6 as part of the pit geology update.
Litho-stratigraphically, with the mapping and revision of drill holes in Tajo Colquijirca, Smelter and Marcapunta, seven units have been characterized: Mitu sandstones, Mitu conglomerate, Shuco conglomerate sensu stricto, Shuco conglomerate in transition, Calera Inferior, Calera medio and last the Calera superior. Pucará limestone absent.
In the Colquijirca open pit, the Fm. Calera Medio has been subdivided into two sequences: the favorable limestones for mineralization, with depths between 75 and 50m, and the unfavorable limestones that act as a ceiling for mineralization, with depths between 25 and 50m.
Geophysics |
Excerpted from (Ellis Geophysical Consulting Inc., 2003)
In 2003, VDG del Perú S.A.C. (VDG) on behalf of Sociedad Minera El Brocal, conducted a gravimetric survey over the Marcapunta property in and around the Colquijirca mine. This geophysical campaign was aimed at delineating the presence of semi-massive to massive sulfides by using gravity measurements. Diamond drilling completed during the last exploration campaigns has shown the presence of economic sulfide occurrences (mainly enargite and chalcopyrite). These sulfides have good specific density contrasts with the host rock, and the applied gravimetric method proved effective during the first campaign completed in 2002. In fact, during the 2002 survey, a ring-shaped gravity anomaly was described and the correlation between gravity maxima and the presence of economic sulfides at depth was very noteworthy. The anomaly remained open to the southeast, and the 2003 gravimetric survey aimed to fully delineate the gravimetric anomaly boundary.
SRK Consulting (Peru) S. A. | May, 2022 |
SRK Consulting Peru SA SEC Technical Report Summary – El Brocal | Page 52 |
In the gravimetric survey, 794 readings were taken on 37 lines. The lines followed an azimuth of N56 ° E and were surveyed from 1500N to 4100S (Figure 7-1).
The 2002 gravimetric survey found gravity anomalies over the mantles. These anomalies continued to the south, suggesting the presence of mineralization. Gravimetric anomalies have been drilled and, based on the El Brocal experience, the strongest anomalies are associated with economic mineralization at depth.
The 2002 filtered data defined the anomaly at Marcapunta as a crescent-shaped zone open to the east. 2003 data completed the map. The Bouguer anomaly map shows a C-shaped anomalous area with a small dip in its center (Figure 7-2).

Figure 7-1: Image of the Marcapunta topography
Source: (Ellis Geophysical Consulting Inc., 2003)
SRK Consulting (Peru) S. A. | May, 2022 |
SRK Consulting Peru SA SEC Technical Report Summary – El Brocal | Page 53 |
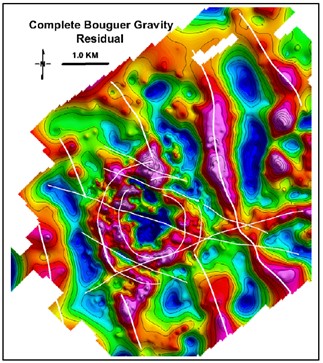
Figure 7-2: Image of the residual complete Bouguer gravity for the Marcapunta Project.
Red is high gravity and blue is low gravity. Major lines are shown in white, as identified in the gravity data superimposed on the residual complete Bouguer gravity.
Source: (Ellis Geophysical Consulting Inc., 2003)
Significant Results and Interpretation |
SRK notes that the property is not at an early stage of exploration, and that results and interpretation if exploration data is generally supported in more detail by extensive drilling and active mining exposure of the orebody in pits and underground works.
Exploration Drilling |
In recent years, during 2019, 12,807 meters of diamond drilling were completed both on the surface and inside the mine. Approximately 84% of this length (10,768 meters) was drilled in the Marcapunta SW and Marcapunta SE (underground) zones to recategorize inferred to measured and indicated resources to Cu-Ag ore reserves, yielding positive results with an increase in Au values. Another 1,115 meters were drilled in 9 drill holes at Marcapunta Sur for geometallurgical studies of arsenical copper ore.
In 2020 to improve geological understanding; 22,816 m of diamond drilling were completed both on surface and inside the mine. 73% of this length (16,662 m) was drilled in the Marcapunta Norte, Marcapunta SW and Marcapunta SE (underground) zones. In addition, 25% of this length corresponds to drilling in Tajo Norte. Another 352 m were drilled in 2 drill holes at Marcapunta Sur for geometallurgical studies of mixed copper ore. At Marcapunta Norte, an underground mine, 2,327.5 meters of development mine workings and 6,896.8 meters of preparation workings were completed, totaling 9,224.3 meters.
SRK Consulting (Peru) S. A. | May, 2022 |
SRK Consulting Peru SA SEC Technical Report Summary – El Brocal | Page 54 |
Drilling Surveys |
Buenaventura’s surveying department is responsible for applying to the collar surveying method to diamond drillholes. To conduct these studies, a total station or differential GPS is used to guarantee the accuracy and tolerance levels required for positioning purposes.
Table 7-1: Table DDH campaigns in El Brocal
Type | Operator | Number of | Metres | |
|---|---|---|---|---|
1969 | DDH | Buenaventura | 2 | 759.90 |
1980 | DDH | Buenaventura | 5 | 1,001.30 |
1981 | DDH | Buenaventura | 8 | 1,723.79 |
1984 | DDH | Buenaventura | 15 | 1,743.25 |
1985 | DDH | Buenaventura | 27 | 3,712.80 |
1987 | DDH | Buenaventura | 19 | 2,469.15 |
1988 | DDH | Buenaventura | 20 | 2,793.55 |
1989 | DDH | Buenaventura | 25 | 3,075.30 |
1990 | DDH | Buenaventura | 12 | 1,126.60 |
1992 | DDH | Buenaventura | 2 | 391.45 |
1994 | DDH | Buenaventura | 35 | 556.00 |
1995 | DDH | Buenaventura | 96 | 19,406.02 |
1996 | DDH | Buenaventura | 120 | 25,258.76 |
1997 | DDH | Buenaventura | 10 | 1,632.00 |
1998 | DDH | Buenaventura | 37 | 5,220.60 |
2000 | DDH | Buenaventura | 14 | 1,271.35 |
2002 | DDH | Buenaventura | 18 | 3,667.05 |
2003 | DDH | Buenaventura | 37 | 13,279.60 |
2004 | DDH | Buenaventura | 12 | 1,601.75 |
2005 | DDH | Buenaventura | 41 | 8,130.35 |
2006 | DDH | Buenaventura | 93 | 23,524.90 |
2007 | DDH | Buenaventura | 258 | 71,864.70 |
2008 | DDH | Buenaventura | 213 | 43,472.20 |
2009 | DDH | Buenaventura | 31 | 2,366.35 |
2010 | DDH | Buenaventura | 48 | 4,021.20 |
2011 | DDH | Buenaventura | 62 | 4,634.85 |
2012 | DDH | Buenaventura | 55 | 5,862.20 |
2013 | DDH | Buenaventura | 40 | 3,734.50 |
2014 | DDH | Buenaventura | 52 | 17,001.25 |
2016 | DDH | Buenaventura | 76 | 11,735.50 |
2017 | DDH | Buenaventura | 365 | 14,463.10 |
2018 | DDH | Buenaventura | 602 | 44,916.15 |
2019 | DDH | Buenaventura | 426 | 27,635.55 |
2020 | DDH | Buenaventura | 329 | 23,997.70 |
2021 | DDH | Buenaventura | 176 | 17,627.80 |
Total | 3,381.00 | 415,678.52 | ||
Source: Buenaventura, 2021
SRK Consulting (Peru) S. A. | May, 2022 |
SRK Consulting Peru SA SEC Technical Report Summary – El Brocal | Page 55 |
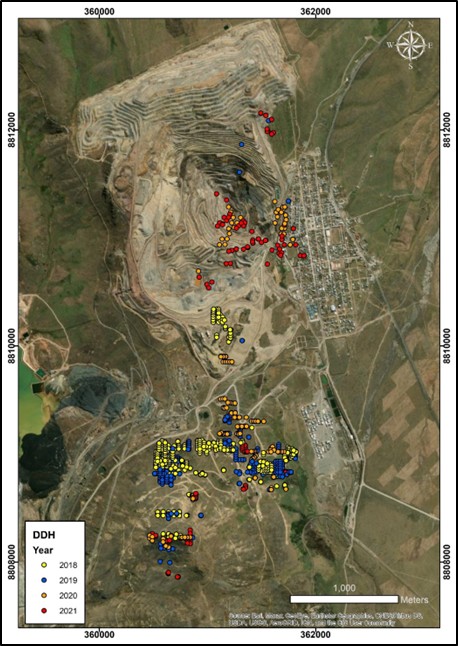
Figure 7-3: Property Drill Collar Location (2018, 2019, 2020 and 2021 campaigns)
Source: SRK, 2021
Sampling Methods and Sample Quality |
The ore body is sampled through diamond drilling programs. The drill patterns, collar spacing, and hole diameter are guided by geological and geostatistical requirements to bolster the reliability of geological interpretation and the confidence of estimation in Mineral Resources block models.
Drill core samples provide information on intact geological contact relationships, mineralogical associations, and structural conditions.
The following is considered during core cutting: first, samples are extracted for density, Terraspec (Pima), as well as other special samples such as point loading and petrography; the entire sample interval will be considered.
SRK Consulting (Peru) S. A. | May, 2022 |
SRK Consulting Peru SA SEC Technical Report Summary – El Brocal | Page 56 |
In general, sample intervals should be no less than 30cm in length to ensure that the sample is more representative and to serve as a basis for the modeling domain. If the mineralized structure is less than 30 cm, the sample must be proportionally completed with wall rock.
The sample obtained from the drill hole is cut into two equal parts using diamond disc cutters (saws) or a “guillotine” splitter when the sample needs to be cut dry; one half of the core becomes the sample, and the other half will be placed in a box for storage.
Drillings conducted in the campaigns have NQ and HQ diameters. After completing the execution of the drillholes, the drilling code is marked as a milestone that symbolizes the collar position.
Downhole Surveying |
Inclined drill holes (0-89°) use a mechanical device used to measure orientation in space. The orientation measurement is calculated through a magnetic survey that uses Reflex and a Gyroscope.
The equipment has a calibration certificate and certified data. Vertical drill holes (90°) and those shallower than 50m are not required to have a survey certificate.
Geological Logging |
All cores are logged by the company under the supervision of El Brocal geologists, and all data is collected through GVMapper software, which is adapted with the unit's own geological codes and allows for much faster logging.
Diamond Drilling Sampling |
In SRK’s opinion, and many agree, diamond drill holes (DDH) generate the most authoritative and representative sampling of subsurface materials available. Diamond core is collected in trays marked with hole identification and down hole depths at the end of each core run.
Core recovery is generally above 95%. For drill core sampling, a symmetrical line is drawn along the core for cutting. The core sampling interval for chemical assays ranges from 0.3 meters to 1.5 meters, considering geological contacts as well as mineralogical variations.
In SRK's opinion, recovery and sampling of drill cores is suitable for resource estimation purposes.
Drilling Type and Extent |
Drilling operations at the project are mainly DDH type. Several campaigns have been carried out throughout the project’s property. Drill holes have been drilled at different orientations and inclinations.
Drilling, Sampling, or Recovery Factors |
SRK has no knowledge of any material drilling factors that may affect the results.
SRK Consulting (Peru) S. A. | May, 2022 |
SRK Consulting Peru SA SEC Technical Report Summary – El Brocal | Page 57 |
Sample Preparation, Analysis and Security |
The procedures for sampling, sample preparation, analysis and quality control for diamond drilling samples are described in this section.
Sample Preparation Methods and Quality Control Measures |
Sampling |
Sampling is performed under the supervision of the field and/or ore control geologist. The core is removed from the core barrels at the rig and placed into core boxes and transported to the logging facility at the end of each drilling shift.
Drillhole sampling is performed at the core storage facility located in the mining unit. Prior to sampling, the core is cut lengthwise into two halves by an automatic core saw, following the cutting line that has been marked by the geologist. The cut core is placed back in the core box. Next, the core boxes are placed on the sampling tables in an orderly fashion. Sampling is done at intervals no less than 0.3m. Each sample ticket has three tags, and the sample interval and QA/QC codes are noted on the ticket. Two sample tags and one half of the sawn core sample are placed in a polyethylene bag, and the other tag is stapled to the outside of the polyethylene bag. The other half of the sample remains in the core box. After completing the sampling of each drill hole, samples are placed in large sacks for their transportation to the internal laboratory or sent to an external laboratory.
For density sampling, representative samples based on geology and mineralization units are selected. Density core samples have a length of 15 to 20 cm and are taken at 5 m intervals along the drillhole, whether it is a mineralized zone or not. The samples are wrapped in plastic film and then tagged. The geologist creates a database with all tagged samples collected and this information is sent to the geology database manager and subsequently recorded on the density sample form. The technician in charge of density measurement photographs the sample outside the core box, which is sent to the internal or external laboratory for density determination. Once the results are obtained, the samples are saved in their respective locations, the results are uploaded to the database and the reports are stored.
Sample Preparation |
El Brocal Internal Laboratory performs the following sample preparation processes (Figure 8-1): First the tagged samples are received and placed in trays. The samples are dried in the furnace at a temperature between 60°C - 100°C. Subsequently, the samples are transported to the crusher, which was previously cleaned by crushing a barren material such as quartz. The sample is crushed until 90% passing -10 mesh (2 mm). Then, the samples are homogenized by using the Jones riffle splitter, and are reduced through successive divisions until obtaining a sample of approximately 400 g. Later, the pulverizing equipment and discs are cleaned using barren quartz sand and compressed air. Samples are pulverized until 95% passing -140 mesh (106 µm). Finally, the pulverized sample is divided into two subsamples of 200 g each, one of which is sent for chemical analysis and the other, stored as pulp to be returned to the geology department for storage.
SRK Consulting (Peru) S. A. | May, 2022 |
SRK Consulting Peru SA SEC Technical Report Summary – El Brocal | Page 58 |
Figure 8-1: Sample Preparation Diagram
Source: BVN - Sampling Manual, 2020
The Certimin Laboratory (current external laboratory) performs the following sample preparation processes: The supervisor receives, orders and check the samples (quantity, state of containers, codes) according to the analysis request. After that a batch code is created, and the data described in the service request is entered. Later, the samples are weighed and registered in the LIMS (Laboratory Information Management System) and/or in a weighing format. Then, the samples are dried at a temperature of 100°C +/- 10°C, 60°C +/- 10°C, or according to the client's request. Subsequently, the samples have a primary crushing to better than 90% passing a 1/4" mesh (6.3 mm). After that, the samples have a secondary crushing to better than 90% passing # -10 mesh (2 mm). Then, the samples are split using a riffle splitter to obtain a sample weight of 200 to 300 g. (The rest of the sample is stored as reject). Later, the samples are pulverized until 85% passing -200 mesh (75 µm). Finally, the laboratory reviews the results of the internal quality control in the
SRK Consulting (Peru) S. A. | May, 2022 |
SRK Consulting Peru SA SEC Technical Report Summary – El Brocal | Page 59 |
sample preparation and if the results are satisfactory, the pulp is retained for the respective chemical analysis.
Density sample preparation includes the following processes: First, the electronic balance is calibrated, then the weight of the initial sample is taken. The samples are placed in the drying oven at a temperature of 105°C. The samples are weighed every 30 minutes until a constant weight is obtained (thus obtaining the drying time). Buenaventura uses the wax-coated water immersion method (paraffin method) to determine density in the geological units. In argillic areas with crumbly material or in highly fractured areas, the density will be determined using the pycnometer.
Chain of Custody |
The chain of custody is supervised by mine geologists and consists of the following procedure: Samples are grouped in consecutive order and placed into sacks, which are subsequently transported to the Internal Laboratory, where the dispatch order is provided (which includes the analysis method to be used, sample quantity, etc.) and the receipt of samples is entered in the database.
In case of deliveries outside the mining unit, constant communication with the shipper is required to monitor the sample transfer, and custody personnel will be available in the transport unit. After the delivery of the samples to the external laboratory, the sample submission and the chain of custody forms will be provided, and these documents shall be signed by the person responsible for receiving the samples. The results are issued by the laboratory through digital reports and are received by the database administrator of the mining unit, who will validate that information.
Sample Preparation, Assaying and Analytical Procedures |
El Brocal mine samples have been analyzed at the onsite El Brocal Internal Laboratory, and at the External Laboratories ACTLABS, CERTIMIN, and ALS, as summarized in the Table 8-1:
Table 8-1: Distribution of samples analyzed according to the laboratory and sampling period
Sample Type | Laboratory | 1969 - 2000 | 2002 - 2010 | 2011 - 2016 | 2017 | 2018 | 2019 | 2020 | 2021 | Total Samples |
Unidentified Laboratory | 29,093 | 20,142 | 2,418 | 0 | 73 | 18 | 17 | 1 | 51,762 | |
SMEB* | 18,273 | 14,255 | 7,158 | 6,850 | 11,150 | 11,897 | 2,143 | 6,469 | 94,688 | |
Drillhole | ACTLABS | 0 | 17,531 | 2,613 | 1,258 | 5,971 | 0 | 0 | 0 | 27,373 |
ALS | 0 | 0 | 1,162 | 0 | 12,037 | 6,183 | 6,598 | 0 | 25,980 | |
CERTIMN | 0 | 7,985 | 1,416 | 0 | 0 | 0 | 6,420 | 25,668 | 29,436 | |
|
|
|
| Total | 224,799 |
Source: SRK, 2021
(*) SMEB: El Brocal Internal Laboratory
El Brocal Internal Laboratory is located in El Brocal Mining Unit (Pasco) and started operations in 1985 and has ISO 9001:2015 certification.
Samples sent to the External Laboratory ALS (Peru) are chemically analyzed at the main headquarters located in Lima (ALS Lima). This laboratory is internationally recognized and has ISO/IEC 17025:2017 certification.
The samples sent to the External Laboratory CERTIMIN (Peru) are chemically analyzed at the main headquarters located in Lima. This laboratory is recognized and has ISO 9001:2015, ISO 14001:2015, and ISO 45001:2018 certifications.
External laboratories ALS, Certimin, ACTLABS were and are independent of Buenaventura.
SRK Consulting (Peru) S. A. | May, 2022 |
SRK Consulting Peru SA SEC Technical Report Summary – El Brocal | Page 60 |
Sample Analysis |
El Brocal Internal Laboratory performs the following sample analysis processes.
| ● | Samples are received and weighed. |
| ● | For total gold analysis (FAAAS), samples are melted, cupellated, and then subjected to gravimetric analysis. |
| ● | For samples tested for multiple elements, wet digestion of samples and instrumental analysis are performed: Ag (AASP) / Cu (AASP) / Fe (AASP) / Pb (AASP) / Zn (AASP) / As (AASP) / Bi (AASP). |
| ● | If the results obtained comply with laboratory quality control standards, the assay certificate is prepared and issued. |
The analytical procedures followed by the current laboratories are shown in Table 8-2 and Table 8-3.
Table 8-2: Analytical methods used at El Brocal Internal Laboratory
Element | Method | Lower limit | Upper limit | Method description |
Au | FAAAS | 0.01 ppm | 10 ppm | Fire Assay - Atomic Absorption Spectroscopy finish |
Ag | 0.01 oz/t | 100 oz/t | Atomic Absorption Spectroscopy - Perchloric digestion | |
Cu | 0.01% | 10% | ||
Pb | 0.01% | 10% | ||
Zn | AASP | 0.01% | 10% | |
Fe | 0.01% | 50% | ||
Bi | 0.01% | 10% | ||
As | 0.01% | 10% | ||
Cu | VOLCU | 10% | 100% | Volumetric |
Pb | VOLPB | 10% | 100% | |
Zn | VOLZN | 10% | 100% |
Source: SRK, 2021
Table 8-3: Analytical methods used at CERTIMIN External Laboratory
Element | Method | Lower limit | Upper limit | Method description |
Au | IC-EF-01 | 0.005 ppm | 10 ppm | Fire Assay - Atomic Absorption Spectroscopy finish |
Au | IC-EF-10 | 2 ppm | 10,000 ppm | Fire Assay - Gravimetric finish |
Ag | IC-VH-59 | 0.1 ppm | 100 ppm | Multielemental Analysis - ICP-OES, ICP-MS - Four Acid Digestion |
Cu | 0.5 ppm | 10,000 ppm | ||
Fe | 0.01% | 15% | ||
Pb | 0.5 ppm | 10,000 ppm | ||
Zn | 0.5 ppm | 10,000 ppm | ||
Ag | IC-VH-134 | 1 ppm | 1,000 ppm | Multielemental Analysis ICP-OES - Four Acid digestion |
Cu | 0.001% | 50% | ||
Pb | 0.001% | 20% | ||
Zn | 0.001% | 30% | ||
Fe | 0.01% | 50% | ||
Ag | IC-EF-15 | 100 ppm | 10,000 ppm | Fire Assay - Gravimetric finish |
PbOx | IC-VH-C022 | 0.01% | 10% | Atomic Absorption Spectroscopy |
ZnOx | 0.01% | 10% |
Source: SRK, 2021
SRK Consulting (Peru) S. A. | May, 2022 |
SRK Consulting Peru SA SEC Technical Report Summary – El Brocal | Page 61 |
Quality Control Procedures/Quality Assurance |
Quality Assurance and Quality Control procedures included the insertion of blank control samples, duplicates and standard reference materials to monitor sampling, sample preparation and analytical processes.
Insertion Rate |
Buenaventura initiated a QAQC program by inserting control samples in drill holes (2007-2021). The control sample insertion program performed on drill hole samples shows an overall insertion rate of 17.7%. The Table 8-4 summarizes the insertion ratio by sample type, period and laboratories.
Table 8-4: El Brocal Control Sample Insertion Rate.
Drillhole Type | Period | Laboratory | # Primary | Blanks | Duplicates | Standard | # Control Samples | Insertion Ratio (%) | |||
# | (%) | # | (%) | # | (%) | ||||||
Diamond drilling | 1969-2012 | No Lab | 51,762 | ||||||||
1985-2006 | SMEB* | 24,494 | |||||||||
2003, 2006-2012 | CERTIMIN | 9,401 | No control samples were inserted | ||||||||
2005-2008 | ACTLABS | 17,475 | |||||||||
Reverse circulation | 2006 | ACTLABS | 56 | ||||||||
Total | 103,188 |
| |||||||||
Diamond drilling | 2007-2021 | SMEB | 53,701 | 2,934 | 5.5% | 4,292 | 8.0% | 1,871 | 3.5% | 9,097 | 16.9% |
2016-2018 | ACTLABS | 9,842 | 543 | 5.5% | 823 | 8.4% | 331 | 3.4% | 1,697 | 17.2% | |
2016-2020 | ALS | 23,680 | 1,391 | 5.9% | 1,996 | 8.4% | 716 | 3.0% | 4,103 | 17.3% | |
2020 | ALS1** | 2,300 | 135 | 5.9% | 204 | 8.9% | 68 | 3.0% | 407 | 17.7% | |
2020-2021 | CERTIMIN | 32,088 | 1,921 | 6.0% | 2,865 | 8.9% | 1,377 | 4.3% | 6,163 | 19.2% | |
Total | 121,611 | 6,924 | 5.7% | 10,180 | 8.4% | 4,363 | 3.6% | 21,467 | 17.7% | ||
(*) SMEB: El Brocal Internal Laboratory
(**) For the QAQC evaluation, an additional item was created for ALS Laboratory ("ALS1") for having a different limit of detection in 2020.
Source: SRK, 2021
Evaluation of Control Samples |
To evaluate control samples (QC), SRK has applied the following criteria:
2. | To evaluate accuracy (standards), SRK uses the limit conventionally accepted by the industry, which is: all standard control samples outside the range of Best Value (BV) ± 3 Standard Deviation (SD), or adjacent samples between the limits of BV+3SD and BV+2SD, or between BV-3SD and BV-2SD are considered as samples outside the acceptable limits. For SRK, 90% of samples must be within the acceptance limits; and |
3. | To evaluate precision (duplicates), SRK compares and applies the HARD index (half of the absolute relative difference) to each original-duplicate sample pair. SRK considers the acceptable the precision evaluation, as follows: |
| ● | For field duplicates, the acceptable HARD value is < 30%. |
| ● | For coarse duplicate samples the acceptable HARD value is < 20%. |
SRK Consulting (Peru) S. A. | May, 2022 |
SRK Consulting Peru SA SEC Technical Report Summary – El Brocal | Page 62 |
| ● | For duplicate pulp or check assay samples the acceptable HARD value is < 10%. |
SRK made an analysis from the historical to recent quality control samples, the summary of the observations found are shown below in the Table 8-5:
Table 8-5: Observations found in the QC analysis.
Laboratory | Period | Sample Type | QC Type | Findings |
|---|---|---|---|---|
SMEB | 2007-2021 | Drill hole | Blanks | There is no evidence of cross-contamination |
Standards | Ag accuracy is acceptable for SRK. But in Au, Cu, Pb and Zn the accuracy is poor. The results obtained in the following standards have low percentage of acceptance: OREAS 94 (Ag, Pb), OREAS 161 (Ag, Cu), GBM³01-5 (Cu, Pb, Zn), MAT-3 (Pb), STRT-01 (Au, Pb), STRT-02 (Au, Cu), GBM997-8 (Pb, Zn), and are not at acceptable limits for SRK. Bias results are variable: In Au, Ag and Cu samples the bias is acceptable. But in Pb and Zn samples the bias is outside acceptance limits. SRK observed that Zn bias is elevated because the best value of the standards is close to the lowest limit of detection of the internal laboratory. | |||
Duplicates | Au, Ag, Cu, and Pb results are acceptable, except for Pb fine duplicates, where the percentage of acceptable samples is low. Zn duplicates’ results are outside SRK’s acceptance limit. | |||
ACTLABS | 2017-2018 | Drill hole | Blanks | There is no evidence of cross-contamination. |
Standards | Cu and Zn accuracy is acceptable for SRK. But in Ag and Pb results, the accuracy is low. The results obtained for the following standards indicate low percentages of acceptance: MCL-01 (Ag), MCL-03 (Ag), OXHYO-03 (Ag, Cu, Pb, Zn), MAT-3 (Au, Cu, Pb, Zn), and are not at acceptable limits for SRK. Bias results are variable: In Cu and Zn, 80% of the samples have results within acceptance limits but in the case of Ag and Pb results, the bias is outside acceptance limits. | |||
Duplicates | Cu results show an acceptable precision. But in Ag, Pb and Zn the precision is poor, and the results are not at acceptable limits for SRK. | |||
ALS | 2017-2020 | Drill hole | Blanks | Blank control samples results for Au, Ag, Pb, and Zn are within acceptable limits. Cu results for coarse blanks TR-17131 and TR-18136 (2018-2019) are outside acceptable limits. |
| | | Standards | The Au, Ag, Cu, Pb, and Zn accuracy is acceptable. The following standards register a low percentage of acceptance: MLC-03 (Cu, Pb, Zn), STRT-03 (Au, Cu), STRT-04 (Cu) and PLSUL27 (Pb). Bias is within acceptable limits for SRK. |
| | | Duplicates | Results for Au, Ag, Cu, and Pb show acceptable precision for SRK. In Zn, the precision is poor, and the results are not at acceptable limits for SRK. |
ALS1 | 2020 | Drill hole | Blanks | There is no evidence of cross-contamination. |
| | | Standards | The Au, Ag, Cu, Pb, and Zn accuracy is acceptable. The following standards have a low percentage of acceptance: STRT-03 (Au) and STRT-04 (Cu, Zn). Bias is within acceptable limits for SRK. |
| | | Duplicates | Au, Ag, Cu, and Pb duplicates results shows good precision, except for Ag field duplicates that has a low percentage of acceptable samples. In Zn, the precision is low, and the results are not at acceptable limits for SRK. |
CERTIMIN | 2020-2021 | Drill hole | Blanks | There is no evidence of cross-contamination. |
| | | Standards | Au, Ag, and Pb accuracy is within acceptable limits for SRK. But in Cu and Zn the accuracy is low. The results obtained for the following standards indicate a low percentage of acceptance for Cu (STRT-02, STRT-03 and STRT-04) and Zn (STRT-02) and are not at acceptable limits for SRK. |
SRK Consulting (Peru) S. A. | May, 2022 |
SRK Consulting Peru SA SEC Technical Report Summary – El Brocal | Page 63 |
Laboratory | Period | Sample Type | QC Type | Findings |
|---|---|---|---|---|
| | | | Bias results are within acceptable limits in Au, Ag, Cu and Pb. In the Zn results of the standard STRT-01, the bias is not at acceptable limits and accuracy is questionable. |
| | | Duplicates | Ag, Cu, Pb and Zn show good precision, except for the Ag field duplicated, which has a low percentage of acceptable samples. Au duplicated results are not at acceptable limits for SRK. |
Source: SRK, 2021
Opinion on Adequacy |
SRK has conducted a comprehensive review of the available QA/QC data as part of the sample preparation, analysis, and security review. SRK believes that the QA/QC protocols are currently consistent with accepted industry best practices.
The insertion of control samples to validate contamination, precision and accuracy of the database is being performed regularly since 2007. SRK observed that the rate of standards control samples in drill holes is less than the rate indicated in Buenaventura's protocol.
Based on SRK criteria for QA/QC review:
There are no evident signs of cross-contamination except for Cu results in coarse blanks sent to ALS external laboratory during the period 2018-2019.
In the precision evaluation, error rates of field, coarse, and pulp duplicates have been highly variable: In ALS external laboratory (ALS and ALS1), the precision is good por Au, Ag, Cu, and Pb, evidencing good repeatability for sample preparation and analysis; however, the results obtained in Zn duplicates are not at acceptable limits. At Certimin external laboratory the precision is good for Ag, Cu, Pb and Zn, but in Au, the precision is poor. At ACTLABS Laboratory the precision for Ag, Pb and Zn is poor, only the results of Cu duplicates are acceptable. At El Brocal internal laboratory, the precision is acceptable for Au, Ag and Cu but in Pb, the results of fine duplicates show poor precision and in Zn, the results for duplicates are not at acceptable limit for SRK. SRK suggests following up on the Au duplicates’ result from Certimin External Laboratory and on the Zn duplicates’ results from the Internal Laboratory (SMEB) in particular, which behave variably.
Regarding the accuracy analysis, the performance of the standard reference materials over the years has been highly variable: ALS External Laboratory (ALS and ALS1) has good accuracy. Certimin External Laboratory has acceptable accuracy form Au, Ag and Pb, while for Cu and Zn the accuracy is poor. In ActLabs Laboratory (2017) and El Brocal Internal Laboratory the accuracy is poor and should be followed up on for corrective action.
In SRK's opinion, sample preparation, chemical analysis, quality control, and security procedures at El Brocal have historically shown that there may be issues with accuracy and precision of results to support the estimation of measured Mineral Resources and proven reserves, especially for areas characterized by analyses at the El Brocal Internal Laboratory. Therefore, SRK has considered the QAQC analysis results as a risk in the classification of Mineral Resources and reduced overall classification accordingly as discussed in Section 11.5.10 of this report.
SRK recommends increasing the insertion rate of standard samples in drill holes to ensure a correct accuracy analysis sorted into high, medium and low-grade standards.
SRK recommends carefully monitoring the behavior of analytical results obtained in quality control samples to inform the internal/external laboratory of any problems detected, if any, for immediate correction.
Non-Conventional Industry Practice |
Buenaventura uses conventional industry practices for the preparation and analysis of samples.
SRK Consulting (Peru) S. A. | May, 2022 |
SRK Consulting Peru SA SEC Technical Report Summary – El Brocal | Page 64 |
Data Verification |
Buenaventura uses a systematic database program (acQuire) to store data and ensure data integrity. Buenaventura provided the collar, survey, assay, sample, density, lithology, alteration, geotechnical data in editable formats (csv, xls) to SRK for verification procedures.
SRK’s data verification consists of:
| ● | Reception of information provided by Buenaventura. |
| ● | Organizing information into a database in Microsoft Access |
| ● | Data modeling (relationships among tables) |
| ● | Construction of samples tracking table (dispatch information) |
| ● | Compilation of laboratory assay reports and link with the samples database |
| ● | Creation of an occurrence table in the assay cross validation. |
| ● | The following is validated for logging information: |
| o | Overlapping of intervals |
| o | Negative intervals |
| o | Intervals larger than the total depth ("Td") of the drill hole |
| o | Data does not extend to the Td of the drill hole |
| o | Blank collar coordinates |
| o | Downhole survey greater than the Td of the drill hole |
| o | Drillholes lacking downhole Surveys |
| o | No downhole data |
| o | The downhole survey data deviates greater than 20 degrees (azimuth) or 10 degrees (inclination) |
Internal data validation |
Buenaventura uses a systematic database program (acQuire) that ensures data integrity and reduces data entry error by implementing requirements and procedures to record data through SIGEO (BVN internal database software) and GVMapper. A visual validation is conducted by Buenaventura's geologist prior to data entry. However, Buenaventura does not have a documented procedure for internal database verification. SRK suggests developing a procedure that contemplates rules for: appropriate data entry; identification of inconsistencies or errors; and subsequent corrective actions.
External data validation |
External validation was performed by SRK in early 2021, which consisted of reviewing drillhole locations; downhole surveys; and comparing the grades versus the original assay certificates from the internal and external laboratories. SRK uses data check routines to validate overlapping intervals, negative (inverted) intervals; drill holes lacking important information such as lithology, recovery or sampling; and lengths in logging or assays that are greater than the total depth of the drillhole.
Data Verification Procedures |
SRK has reviewed the information provided by Buenaventura, which consisted or 3,685 diamond drillholes (224,743 samples) and 3 reverse circulation drillholes (56 samples) totaling 3,688 collars and 224,799 samples (Table 9-1).
SRK Consulting (Peru) S. A. | May, 2022 |
SRK Consulting Peru SA SEC Technical Report Summary – El Brocal | Page 65 |
Table 9-1: Summary of drilling information provided by Buenaventura.
Type | No. of Collars | Total length (m) | Samples |
Diamond drilling | 3,685 | 453,444.4 | 224,743 |
Reverse circulation | 3 | 668.0 | 56 |
Total | 3,688 | 454,112.4 | 224,799 |
Source: SRK, 2021
Database Validation |
SRK validated the main tables of the database. The procedures applied in the database validation and the observations found are summarized in the Table 9-2.
Table 9-2: Database validation summary
Tables | Comments |
Collar | SRK plotted the drillholes to check their spatial location and it was verified that none of the drillholes are located very far from the zone of influence of the mine. All data is adequate; no observations were found. |
Survey | SRK verified that there are no collars with inverted inclination or significant variations in azimuth and inclination: 167 drill holes were found to have azimuth deviation greater than 20°; all of these drillholes have an inclination close to 90° (vertical) so this deviation is acceptable. |
Samples | SRK verified that the samples do not overlap in intervals and that there are no samples with intervals greater than the total collar depth. All data is adequate; no observations were found. |
Density | A total of 12,828 density samples were analyzed at the El Brocal Internal Laboratory and 1,193 samples were analyzed at ACTLABS External Laboratory, both using the paraffin method. All provided data is adequate; no observations were found. |
Lithology | SRK verified that there are no overlapping intervals, negative intervals, and intervals greater than the total drill hole depth; the data is adequate. SRK found that 207 drillholes have no lithology information; these drillholes correspond to historical information (1980-2007). |
Recovery and RQD | SRK checked to see if there are missing intervals of RQD information; overlapping intervals; or intervals with RQD information greater or less than the drillhole length. All data is adequate; no observations were found. |
Source: SRK, 2021
Assay Validation |
In order to perform the assay cross validation, SRK linked the database with a compilation of assay certificates from laboratories (ALS, ACTLABS, CERTIMIN, and El Brocal Internal Laboratory) in CSV and XLS format. The observations found are summarized in the Table 9-3.
Table 9-3: Observations found in the Assay Cross Validation
Total | % | Assay Cross Validation | ||
|---|---|---|---|---|
Laboratory | Samples | Database | Verification | Comments |
No Laboratory | 51,762 | 23.0% | SRK could not check these samples. | Samples with no laboratory identified. |
SMEB | 78,195 | 34.8% | SRK verified 85.3% of the samples. | 24,975 samples, which reported very low assay results in the certificate of analysis, were replaced in the Database by a value close to the limit of detection of the element (Au=0.005 ppm, Ag=0.005oz, Cu, Pb, Zn, PbO, and ZnO=0.005%), but this was deemed immaterial. |
No analysis extension certificates were provided for 5,618 samples. | ||||
ACTLABS | 27,373 | 12.2% | SRK verified 98.5% of the samples. | No analysis extension certificates were provided for 82 PbO and ZnO samples. |
SRK Consulting (Peru) S. A. | May, 2022 |
SRK Consulting Peru SA SEC Technical Report Summary – El Brocal | Page 66 |
Laboratory | Total | % | Assay Cross Validation | |
| | | Verification | Comments |
No analysis extension certificates were provided for 15,364 samples. | ||||
ALS | 25,980 | 11.5% | SRK verified 100.0% of the samples. | 249 samples, which reported very low assay results in the certificate of analysis, were replaced in the Database by a value close to the limit of detection of the element, but this deemed immaterial. |
No analysis extension certificates were provided for 99 samples. | ||||
CERTIMIN | 41,489 | 18.5% | SRK verified 99.8% of the samples. | In 525 PbO and ZnO samples (with very low assay results on Certificate) were replaced in the Database by a value close to the limit of detection of each element, but this was deemed immaterial. |
No analysis extension certificates were provided for 1,368 samples (1,177 in Cu). | ||||
Total | 224,799 | 100.0% | ||
Source: SRK, 2021
In the cross validation of the assay information, SRK found that certain values in the Database do not match the Laboratory assay certificates; however, the total number of affected samples stood at 656 (0.3% of total samples), which is considered insignificant and do not have a material impact on the Mineral Resources Estimation
Limitations |
SRK was unable to perform the cross validation of 11,991 samples (5.3% of total samples) because the original assay certificates were not available by the delivery deadline given to Buenaventura. Additionally, 51,762 samples (23% of total samples) could not be validated because the laboratory certificate was not identified. Most of these samples correspond to historical information (1969-2012) located in areas that have been already mined and not deemed material to the disclosure of Mineral Resources.
Opinions and recommendations on database quality |
SRK has noted that the database contains historical information with no laboratory certificates, which means that cross validation could not be performed on this information. In SRK's opinion, the remaining information that could be validated is consistent and acceptable for Mineral Resources Estimation.
SRK has observed that the database has a number of minor findings or inconsistencies, the vast majority of which correspond to historical information obtained from data migration. Although a complete reconciliation of the certificate information to the digital database could not be completed, SRK notes that most of the current resource is supported by contemporary information that could be compared to original certificate information. The incidence of error for the data that could be compared was limited and not deemed material to the disclosure of Mineral Resources.
SRK recommends performing an internal validation procedure for the Buenaventura Database Management System (SIGEO), making a checklist of the data export processes, and issuing Internal Laboratory analytical certificates for future estimations. SRK also recommends improving the internal database management system for auditing purposes to ensure the availability of sufficient information for data traceability.
SRK Consulting (Peru) S. A. | May, 2022 |
SRK Consulting Peru SA SEC Technical Report Summary – El Brocal | Page 67 |
Mineral Processing and Metallurgical Testing |
Ore Supply |
El Brocal’s mineral processing facilities include two independent conventional flotation plants. Plant 1 processes copper ore while Plant 2 processes lead and zinc ores. Plant 1 receives ore from Marcapunta mine, and Plant 2 receives fresh ore from Tajo Norte mine and low silver content ore from Marcapunta, see Table 10- 1 and Figure 10-1.
For the period 2017 to November 2020, the combined plants processed approximately 22.8 million tons of fresh ore, which is equivalent to an average of 5.7 million per year or 15,600 tons per day (approximately) when considering 365 days per annum. The plants’ combined nominal capacity is 18,000 tons per day.
Table 10-1: El Brocal, Mill Feed Sourcing, 2017 to 2020 November Period
Parameter | Units | Marcapunta | Tajo Norte | Global |
Fresh Ore | Tonne | 10,174,640 | 12,591,011 | 22,765.651 |
Ore Grade | Ag oz/tonne | 0.67 | 1.27 | 1.00 |
Ore Grade | Cu% | 1.76% | 0.00% | 0.79% |
Ore Grade | As% | 0.58% | 0.00% | 0.26% |
Ore Grade | Fe% | 16.82% | 16.65% | 16.73% |
Ore Grade | Au g/tonne | 0.54 | 0.00 | 0.240 |
Ore Grade | Pb% | 0.00% | 1.16% | 0.64% |
Ore Grade | Zn% | 0.00% | 2.65% | 1.46% |
Ore Grade | PbOx% | 0.00% | 0.32% | 0.18% |
Ore Grade | ZnOx% | 0.00% | 0.32% | 0.02% |
Source: Buenaventura

Figure 10-1: El Brocal, Fresh Ore Destination and Final Products
Source: SRK
Marcapunta is an underground mine. In 2017-2020, approximately 93% of its ore production qualified as copper-silver rich ore that was processed in Plant 1; the balance of approximately 7% fed Plant 2. Overall, Marcapunta represented only 6% (approximately) of Plant 2’s total throughput.
SRK Consulting (Peru) S. A. | May, 2022 |
SRK Consulting Peru SA SEC Technical Report Summary – El Brocal | Page 68 |
Table 10-2-: El Brocal, Mill Feed Composition by Period
Unit | Ore | Parameter | Units | 2017 | 2018 | 2019 | 2020 | Total |
Fresh Ore | tonne | 2,524,399 | 2,799,834 | 2,596,527 | 1,516,897 | 9,437,657 | ||
Ore Grade | Ag oz/tonne | 0.66 | 0.72 | 0.75 | 0.74 | 0.72 | ||
Ore Grade | Cu % | 1.91% | 1.66% | 1.70% | 1.97% | 1.79% | ||
Ore Grade | As % | 0.62% | 0.54% | 0.56% | 0.64% | 0.58% | ||
Marcapunta | Ore Grade | Fe % | 15.7% | 16.0% | 18.4% | 17.3% | 16.8% | |
Plant 1 | / Total | Ore Grade | Au g/tonne | 0.559 | 0.528 | 0.535 | 0.551 | 0.542 |
Plant 1 | Ore Grade | Pb % |
|
|
|
|
| |
Ore Grade | Zn% |
|
|
|
|
| ||
Ore Grade | PbOx % |
|
|
|
|
| ||
Ore Grade | Zn Ox% |
|
|
|
|
| ||
Fresh Ore | tonne | 0 | 407,386 | 329,597 | 0 | 736,983 | ||
Ore Grade | Ag oz/tonne | 0.00 | 0.00 | 0.00 | 0.00 | 0.00 | ||
Ore Grade | Cu % | 0.00% | 1.39% | 1.57% | 0.00% | 1.47% | ||
Ore Grade | As % | 0.00% | 0.45% | 0.52% | 0.00% | 0.48% | ||
Ore Grade | Fe % | 0.0% | 16.2% | 18.3% | 0.0% | 17.1% | ||
Marcapunta | Ore Grade | Au g/tonne | 0.000 | 0.428 | 0.558 | 0.000 | 0.486 | |
Ore Grade | Pb % |
|
|
|
|
| ||
Ore Grade | Zn% |
|
|
|
|
| ||
Ore Grade | PbOx % |
|
|
|
|
| ||
Ore Grade | Zn Ox% |
|
|
|
|
| ||
Fresh Ore | tonne | 3,126,616 | 3,305,125 | 3,385,019 | 2,774,251 | 12,591,011 | ||
Ore Grade | Ag oz/tonne | 1.30 | 1.16 | 1.36 | 1.23 | 1.27 | ||
Ore Grade | Cu % |
|
|
|
| 0.00% | ||
Plant 2 | Ore Grade | As % |
|
|
|
| 0.00% | |
Tajo Norte | Ore Grade | Fe % | 17.5% | 15.7% | 15.8% | 17.9% | 16.65% | |
Ore Grade | Au g/tonne |
|
|
|
| 0.000 | ||
Ore Grade | Pb % | 1.13% | 1.15% | 1.25% | 1.07% | 1.16% | ||
Ore Grade | Zn% | 2.67% | 2.33% | 2.43% | 3.27% | 2.65% | ||
Ore Grade | PbOx % | 0.42% | 0.32% | 0.27% | 0.28% | 0.32% | ||
Ore Grade | Zn Ox% | 0.00% | 0.00% | 0.00% | 0.14% | 0.03% | ||
Fresh Ore | tonne | 3,126,616 | 3,712,511 | 3,714,615 | 2,774,251 | 13,327,994 | ||
Ore Grade | Ag oz/tonne | 1.30 | 1.04 | 1.24 | 1.23 | 1.20 | ||
Ore Grade | Cu % | 0.00 | 0.15% | 0.14% | 0.00% | 0.08% | ||
Ore Grade | As % | 0.00 | 0.05% | 0.05% | 0.00% | 0.03% | ||
Ore Grade | Fe % | 0.17 | 15.8% | 16.1% | 17.9% | 16.7% | ||
Total Plant 2 | Ore Grade | Au g/tonne | 0.00 | 0.047 | 0.049 | 0.000 | 0.027 | |
Ore Grade | Pb % | 0.01 | 1.03% | 1.14% | 1.07% | 1.09% | ||
Ore Grade | Zn% | 0.03 | 2.07% | 2.22% | 3.27% | 2.50% | ||
Ore Grade | PbOx % | 0.00 | 0.28% | 0.25% | 0.28% | 0.30% | ||
Ore Grade | Zn Ox% | 0.00% | 0.00% | 0.00% | 0.14% | 0.03% |
Source: Buenaventura
Marcapunta’s ore mineralogy includes mainly copper sulfides like Enargite with minor content of Chalcocite, Chalcopyrite, Tennantite, Luzonite, and Colusite, while the gangue composition includes mostly Pyrite, Quartz, Alunite, Kaolinite, and Clays.
SRK Consulting (Peru) S. A. | May, 2022 |
SRK Consulting Peru SA SEC Technical Report Summary – El Brocal | Page 69 |
Marcapunta mine’s monthly ore supply is shown on Figure 10-2. Overall, there is a difference of approximately 400,000 tonnes or 4% between ore tonnes reported by the Marcapunta mine and ore tonnes reported by the processing facilities.
Overall, Marcapunta’s monthly average head grades remained relatively steady with copper grades ranging approximately between 1.6% and 2.3%; silver, between 0.55 oz/t to 1.15 oz/t; arsenic, between 0.5% and 0.75%; and gold from 0.4 g/t to 0.8 g/t. The iron’s head grade showed a trend to higher values starting from approximately 1.6% in 2017 and approaching 2% in 2020.
Figure 10-2: Marcapunta Ore Production
Source: Buenaventura
Marcapunta ore allocation to Plant 1 and Plant 2 is shown in Figure 10-3. In 2018 and 2019, a minor fraction (736,893 tonnes) of Marcapunta’s ore was sent for processing in Plant 2.

Figure 10-3: Marcapunta Ore Allocation to Plant 1 and Plant 2
Source: Buenaventura
When considering 365 day per year, Marcapunta 2017’s daily average ore production reached 6,916 tonnes; 8,787 tonnes/day in 2018; 8,017 tonnes/day in 2019; and 4,156 tonnes/day in 2020; the result for 2020 represented a drop of approximately 50% from the previous year’s average. Ore production in year 2020 was unusually low and there was virtually no production in April and May. This is considered an anomaly, which was attributable to unexpected external factors that were associated in large part with the COVID-19 crisis. The figures from 2018 to 2019 suggest
SRK Consulting (Peru) S. A. | May, 2022 |
SRK Consulting Peru SA SEC Technical Report Summary – El Brocal | Page 70 |
that in a normal operating year, Marcapunta should be able to deliver ore in the range of 8,000 to 8,800 t per day.
Tajo Norte’s main credit minerals includes copper, lead, and zinc sulfides as Galena, Sphalerite, and minor quantities of Pb-Ag galena and some Pb and Zn oxides are also present; the main gangue minerals include Pyrite, Barite, Hematite, and Siderite.
Tajo Norte mine’s monthly ore supply is shown on Figure 10-4. Overall, the difference between ore tonnes reported by the Tajo Norte mines and those registered by the processing facilities totaled approximately 1.2 million tonnes or 10%.
When considering a 365-day year, Tajo Norte 2017’s daily average of ore production reached 8,566 tonnes. The figure in 2018 was 9,055 tonnes/day and in 2019, 9,274 tonnes/day. In 2020, the figure stood at 7,606 tonnes/day and reflected a drop of 15% from the previous year’s average. When compared to Marcapunta, it appears that the unforeseen external factors that affected he company in 2020 had a significantly lower impact on Tajo Norte’s ore production.
Tajo Norte’s head grades
● Copper grades are typically low below 0.05%; in October and November 2020, they increased to 0.4% but returned to typical values in December
● Lead ranges from 0.59% to 2.65% with an overall weighted average of 1.17%
● Silver appears typically ranging from 0.58 oz/t to 3.19 oz/t, with an overall weighted average of 1.29 oz/t.
● Lead oxide, or PbOx, is steady in the period, ranging from 0.15% to 0.51% with an overall weighted average of 0.26%.
● Zinc head grades appear to be more variable that the other elements in the feed, ranging from 1.91% to 4.35% with an overall weighted average of 2.67%
● Zinc oxide or ZnOx shows a similar profile to that of PbOx, but with slightly lower values. ZnOx ranges from 0.10% to 0.46% with an overall weighted average of 0.20%

Figure 10-4: Tajo Norte Ore Production
Source: Buenaventura
Sample Representativeness |
Plant 1 is a conventional concentration plant that produces copper concentrate which is trucked offsite to be sold to third parties. The plant’s unit processes include crushing, grinding, flotation, final tails thickening and disposal in a conventional tailing’s storage facility as well as thickening and filtration of the final concentrate stream produced by the flotation plant. A simplified block flow diagram of Plant 1 is shown in Figure 10-5.
SRK Consulting (Peru) S. A. | May, 2022 |
SRK Consulting Peru SA SEC Technical Report Summary – El Brocal | Page 71 |

Figure 10-5: Simplified Block Flow Diagram, Plant 1
Source: SRK
Plant 1’s operating time is shown in Table 10-3. If we exclude 2020’s figures, the average operating hours reported translate into 88.8% operating time, which corresponds to 339 tonnes/hour or 8,143 tonnes using a 24 hour per day basis.
Marcapunta mine’s ore production, which ranged from 8,000 to 8,800 tonnes/d, seems a close match with Plant 1’s processing capacity of 8,143 tonnes/d. The 88% operating time leaves room for improvement because a properly operated plant of this size should be in the 90% to 95% range and sometimes higher.
Table 10-3: Operating Time and Throughput
Plant 1 | |||||
Year | Operating hours | Operating time ratio | Ore Tonnes | Tonnes/hour | Tonnes/day |
2017 | 7,656 | 87.4% | 2,524,399 | 330 | 7,914 |
2018 | 7,856 | 89.7% | 2,799,834 | 356 | 8,554 |
2019 | 7,835 | 89.4% | 2,596,527 | 331 | 7,954 |
2020 (*) | 2,122 | 24.2% | 1,516,897 | 715 | 17,160 |
Total 2017-2019 | 23,346 | 88.8% | 7,920,760 | 339 | 8,143 |
Source: Buenaventura
* Partial Data
Production figures from Plant 1 are shown on Table 10-04 and Figure 10-6. Silver bearing concentrate (Copper Concentrate 1) has been produced on a regular basis but Copper Concentrate 2 containing no silver was produced only in 2018 and 2019.
Table 10-4: Plant 1´s Overall Performance
Stream | Units | 2017 | 2018 | 2019 | 2020 | Total |
|---|---|---|---|---|---|---|
Fresh Ore | tonnes | 2,524,399 | 2,799,834 | 2,596,527 | 1,516,897 | 9,437,657 |
Ag oz/t | 0.66 | 0.72 | 0.75 | 0.74 | 0.72 | |
Cu% | 1.91% | 1.66% | 1.70% | 1.97% | 1.79% | |
As% | 0.62% | 0.54% | 0.56% | 0.64% | 0.58% | |
Fe% | 15.7% | 16.0% | 18.4% | 17.3% | 16.8% | |
Au g/t | 0.56 | 0.53 | 0.54 | 0.55 | 0.54 |
SRK Consulting (Peru) S. A. | May, 2022 |
SRK Consulting Peru SA SEC Technical Report Summary – El Brocal | Page 72 |
SRK Consulting (Peru) S. A. | May, 2022 |
SRK Consulting Peru SA SEC Technical Report Summary – El Brocal | Page 73 |
Stream | Units | 2017 | 2018 | 2019 | 2020 | Total |
|---|---|---|---|---|---|---|
CuOx % | 0.11% | 0.09% | 0.00% | 0.07% | 0.07% | |
Copper Concentrate 1 | tonnes | 174,795 | 165,682 | 160,307 | 107,743 | 608,527 |
Ag oz/t | 6.05 | 7.59 | 7.17 | 5.88 | 6.74 | |
Cu% | 25.8% | 25.7% | 25.1% | 25.2% | 25.5% | |
As% | 8.5% | 8.4% | 8.3% | 8.3% | 8.4% | |
Fe% | 18.1% | 17.5% | 19.3% | 18.8% | 18.4% | |
Au g/t | 4.01 | 3.76 | 3.36 | 3.08 | 3.60 | |
Rec Ag | 63.2% | 62.4% | 58.6% | 56.8% | 60.6% | |
Rec Cu | 93.5% | 91.3% | 91.3% | 90.9% | 91.9% | |
Rec As | 94.4% | 92.0% | 91.9% | 91.8% | 92.6% | |
Rec Fe | 8.0% | 6.5% | 6.5% | 7.8% | 7.1% | |
Rec Au | 49.7% | 42.1% | 38.7% | 39.7% | 42.9% | |
Mass pull | 6.92% | 5.92% | 6.17% | 7.10% | 6.45% | |
Copper Concentrate 2 | tonnes | 0 | 19,980 | 18,341 | 0 | 38,320 |
Ag oz/t | 0 | 0 | 0 | 0 | 0 | |
Cu% | 0.0% | 24.8% | 25.0% | 0.0% | 24.9% | |
As% | 0.0% | 8.1% | 8.3% | 0.0% | 8.2% | |
Fe% | 0.0% | 18.2% | 18.2% | 0.0% | 18.2% | |
Au g/t | 0.00 | 3.13 | 3.40 | 0.00 | 3.26 | |
Rec Ag | 0.00% | 0.00% | 0.00% | 0.00% | 0.00% | |
Rec Cu | 0.00% | 10.64% | 10.41% | 0.00% | 10.52% | |
Rec As | 0.00% | 10.61% | 10.49% | 0.00% | 10.55% | |
Rec Fe | 0.00% | 0.82% | 0.70% | 0.00% | 0.75% | |
Rec Au | 0.00% | 4.22% | 4.49% | 0.00% | 4.35% | |
Mass pull | 0.00% | 0.71% | 0.71% | 0.00% | 0.71% | |
Concentrate Total | tonnes | 174,795 | 185,662 | 178,647 | 107,743 | 646,847 |
Ag oz/t | 6.05 | 6.78 | 6.43 | 5.88 | 6.34 | |
Cu% | 25.8% | 25.6% | 25.1% | 25.2% | 25.4% | |
As% | 8.5% | 8.4% | 8.3% | 8.3% | 8.4% | |
Fe% | 18.1% | 17.6% | 19.2% | 18.8% | 18.4% | |
Au g/t | 4.01 | 3.69 | 3.36 | 3.08 | 3.58 | |
Rec Ag | 63.2% | 62.4% | 58.6% | 56.8% | 60.6% | |
Rec Cu | 88.6% | 96.7% | 101.7% | 87.7% | 94.0% | |
Rec As | 94.4% | 102.6% | 102.3% | 91.8% | 98.3% | |
Rec Fe | 8.0% | 7.3% | 7.2% | 7.8% | 7.5% | |
Rec Au | 49.7% | 46.3% | 43.2% | 39.7% | 45.3% | |
Mass pull | 6.92% | 6.63% | 6.88% | 7.10% | 6.85% |
Source: Buenaventura
Over the 4-year period, only a minor fraction of the total copper concentrate production (0.41%) was Concentrate 2 (without any declared silver content).
Copper concentrate production reached typical commercial quality grades for copper of around 25% but also contained high arsenic values around 8% or higher. This makes it difficult to sell in the open market. Traders, who are the most likely buyer of a concentrate with these characteristics, will apply significant discounts because of the presence of deleterious elements. Arsenic is the only deleterious element that El Brocal has declared. Precious metals in Concentrate 1 include silver grading 6.74 oz/t average and gold at 3.6 grams per tonne.
In terms of metallurgical recovery for Concentrate 1 (containing Ag), and consistent with the fact that Enargite is one of the principal minerals, both copper and arsenic show a recovery to
SRK Consulting (Peru) S. A. | May, 2022 |
SRK Consulting Peru SA SEC Technical Report Summary – El Brocal | Page 74 |
concentrate of 90% and above. Silver deportment was consistently around 60% and gold was also consistent, averaging 42.9% recovery in the period.
Copper Concentrate 1 tonnes production show a downward trend (see Figure 10-6) that is not necessarily consistent with copper head grades. If we exclude anomalous data from 2020, the tonnes of Copper Concentrate 1 consistently dropped from the approximately 175,000 tonnes in 2017 to 160,000 in 2019. Metallurgical recovery for all metals, as well as mass pull, show a similar trend. Apparently, Plant 1 is operating on a mass pull basis and its selectivity, or ability to differentially float minerals of interest, is limited. Note that pyrite, most likely represented by Fe recovery, remained or increased over the same period. Plant 1’s performance suggests a mineral liberation issue that typically originates in substandard operations of the comminution circuit and/or the flotation circuit (residence time, solids concentration, reagents dosing, flotation air, agitation).

Figure 10-6: Plant 1’s Overall Performance
Source: Buenaventura
Plant 1’s daily performance in terms of fresh feed and grinding product (P80) is shown on Figure 10-7, and Figure 10-8 showing tonnage as function of P80. It is evident that a significant variation in tonnage and P80 occurs on a day-to-day basis. The tonnage v/s P80 relationship also shows a highly variable operation, which suggests a lack of suitable operating practices and process controls.
SRK Consulting (Peru) S. A. | May, 2022 |
SRK Consulting Peru SA SEC Technical Report Summary – El Brocal | Page 75 |

Figure 10-7: Plant 1 – Daily Performance – Throughput and Grinding P80
Source: Buenaventura
Beginning around 2019, Plant 1’s throughput and P80 show a downward trend, where tonnage and P80 are consistently lower. Around July 2019, P80 values appear to repeat while the tonnage varied significantly; this suggests improper metallurgical accounting and/or errors when sampling, measuring, and recording operational variables.
Figure 10-8: Plant 1, Throughput versus Grinding P80
Source: Buenaventura
Plant 2, Lead and Zinc Ore |
Plant 2 is a conventional concentration plant that produce lead and zinc concentrates through a multistage classification and flotation circuit, see Figure 10-9. Ore is initially classified by size using a combination of screen and hydrocyclons to produce a coarse stream, a fines stream, and ultrafines stream. The Coarse stream feeds the lead flotation circuit, and its concentrate becomes final lead concentrate; this stream’s tails feed the zinc flotation circuit. Concentrate from the zinc circuit becomes final zinc concentrate, and its tails become final tails that are thickened and then disposed of in a conventional tailing’s storage facility. The Fines as well as the Ultrafines fraction feed independent flotation circuits to produce zinc concentrate that is blended with similar elements from the Coarse fraction in a dedicated thickening and filtration circuit. Tails from each Fines and Ultrafines circuits join the final tails stream at the tailing’s storage facility.
SRK Consulting (Peru) S. A. | May, 2022 |
SRK Consulting Peru SA SEC Technical Report Summary – El Brocal | Page 76 |

Figure 10-9: Simplified Block Flow Diagram, Plant 2
Source: SRK
Plant 2’s operating time is shown in Table 10-5. When ignoring 2020 figures, the average operating hours reported reached 75.1% equivalent to 535 t/hour.
A concentration plant of comparable size to Plant 2 typically operates around 90% to 95% of the time. When considering 2017- 2019 average of 535 t per hour, if Plant 2 works at 90% operating time, then it should be able to process on average 11,500 tonnes/day, and at 95% operating time the throughput could reach 12,200 tonnes/day.
There are numerous elements that can contribute to low operating times at a concentrator; a non-exhaustive list includes:
| ● | Shortage of ore supply. In this case, Tajo Norte’s historical data shows it has the capacity to produce ore ranging from 8,500 to 9,000 tonnes per day, which is equivalent to 9,000t/d / 535t/h / 24h/d =70%. This suggests that Tajo Norte is not supplying enough ore to maintain Plant 2 at full capacity. |
| ● | The mechanical condition of equipment forces frequent, typically unplanned shutdowns. The available data is not detailed enough to conclude if this is a major or minor contributing factor. Unplanned shutdowns also negatively impact the overall metallurgical performance of the concentrator. |
| ● | Lack of proper budget to maintain the mechanical condition of the equipment, which may be attributable to an insufficiently manned maintenance crew; a scarcity of spare parts; or a combination thereof. |
| ● | Personnel lack the training or skills to service the equipment. |
| ● | Substandard operating condition of equipment. |
As indicated in the aforementioned list, the potential reasons for low utilization time of the facilities are multiple, and in SRK’s experience, a combination of these is the usual answer. El Brocal would need to systematically evaluate these factors to ensure that its facilities are performing at optimum
SRK Consulting (Peru) S. A. | May, 2022 |
SRK Consulting Peru SA SEC Technical Report Summary – El Brocal | Page 77 |
capacity. It is also SRK’s experience that resolving these issues will have a positive impact on ore throughput (higher), maintenance expenditure, and sometimes on the direct cost of processing, which in aggregate, positively impact the company’s production cost.
Table 10-5: Plant 2, Operating time and Throughput
Plant 2 | |||||
Year | Operating hours | Operating time ratio | Ore tonnes | Tonnes/hour | Tonnes/day |
2017 | 6,455 | 73.7% | 3,126,616 | 484 | 11,625 |
2018 | 6,564 | 74.9% | 3,712,511 | 566 | 13,575 |
2019 | 6,711 | 76.6% | 3,714,615 | 553 | 13,284 |
2020 (*) | 2,267 | 25.9% | 2,774,251 | 1,224 | 29,376 |
Total 2017-2019 | 19,730 | 75.1% | 10,553,743 | 535 | 12,838 |
Source: Buenaventura
* Partial Data
Lead concentrate production increased in 2017-2019 and showed an opposite trend to lead’s head grade and concentrate mass pull, but a positive correlation with lead recovery, see Table 10-5 and Figure 10-10. These results suggest that Plant 2 has the potential to consistently reach higher than current values, likely 60% or above lead recovery and concentrate production in the order of 50,000 tonnes. The presence of zinc in concentrate is high at approximately 7% and is likely triggering penalty charges in the market. Silver content averaged 40 oz/t approximately; no gold content is reported. Mass pull was reasonably steady with an average of 1.3% over the 2017- 2020 period.
Zinc concentrate production ranged between 90,000 to 100,000 tonnes/year with an unusually steady zinc grade in concentrate that averaged 49.4% over the 2017-2020 period. Lead content, with an average of 3.6%, is high and likely triggering penalty charges with buyers. Iron recovery suggests an improvement in rejecting pyrite from 2017 at 1.02% down to 0.80% in 2019.
No deleterious elements are reported for either the mill feed or in final concentrates generated by Plant 2.
SRK Consulting (Peru) S. A. | May, 2022 |
SRK Consulting Peru SA SEC Technical Report Summary – El Brocal | Page 78 |
Table 10-6: Plant 2´s Overall Performance
Stream | Units | 2017 | 2018 | 2019 | 2020 | Total |
Fresh ore | tonnes | 3,126,616 | 3,712,511 | 3,714,615 | 2,774,251 | 13,327,994 |
Ag oz/t | 1.30 | 1.04 | 1.24 | 1.23 | 1.20 | |
Pb% | 1.13% | 1.03% | 1.14% | 1.07% | 1.09% | |
Zn% | 2.7% | 2.1% | 2.2% | 3.3% | 2.5% | |
Fe% | 17.5% | 15.8% | 16.1% | 17.9% | 16.7% | |
Concentrate Pb | tonnes | 41,435 | 42,584 | 53,448 | 36,718 | 174,185 |
Ag oz/t | 46.21 | 38.73 | 37.25 | 36.98 | 39.68 | |
Pb% | 48.8% | 49.4% | 47.5% | 47.1% | 48.2% | |
Zn% | 6.3% | 6.5% | 7.4% | 7.7% | 7.0% | |
Fe% | 7.8% | 7.3% | 7.4% | 8.3% | 7.7% | |
Rec Ag | 47.2% | 42.8% | 43.1% | 39.8% | 43.4% | |
Rec Pb | 57.3% | 55.3% | 59.8% | 58.0% | 57.6% | |
Rec Zn | 3.1% | 3.6% | 4.8% | 3.1% | 3.6% | |
Rec Fe | 0.6% | 0.5% | 0.7% | 0.6% | 0.6% | |
Mass pull | 1.3% | 1.1% | 1.4% | 1.3% | 1.3% | |
Concentrate Zn | tonnes | 97,527 | 90,161 | 91,384 | 102,056 | 381,128 |
Ag oz/t | 10.45 | 10.20 | 12.91 | 8.32 | 10.41 | |
Pb% | 3.6% | 3.9% | 3.9% | 2.9% | 3.6% | |
Zn% | 49.7% | 49.5% | 49.3% | 49.2% | 49.4% | |
Fe% | 5.7% | 5.4% | 5.2% | 6.1% | 5.6% | |
Rec Ag | 25.1% | 23.9% | 25.6% | 24.9% | 24.9% | |
Rec Pb | 10.1% | 9.3% | 8.4% | 10.0% | 9.4% | |
Rec Zn | 58.1% | 58.0% | 54.7% | 55.3% | 56.5% | |
Rec Fe | 1.02% | 0.84% | 0.80% | 1.3% | 1.0% | |
Mass pull | 3.1% | 2.4% | 2.5% | 3.7% | 2.9% | |
Concentrate Total | tonnes | 138,961 | 132,745 | 144,832 | 138,774 | 555,313 |
Ag oz/t | 21.11 | 19.35 | 21.89 | 15.90 | 19.59 | |
Pb% | 17.1% | 18.5% | 20.0% | 14.6% | 17.6% | |
Zn% | 36.8% | 35.7% | 33.8% | 38.2% | 36.1% | |
Fe% | 6.4% | 6.0% | 6.0% | 6.7% | 6.3% | |
Rec Ag | 72.3% | 66.7% | 68.7% | 64.7% | 68.3% | |
Rec Pb | 67.4% | 64.6% | 68.1% | 67.9% | 67.0% | |
Rec Zn | 61.2% | 61.6% | 59.5% | 58.5% | 60.1% | |
Rec Fe | 1.6% | 1.4% | 1.5% | 1.9% | 1.6% | |
Mass pull | 4.4% | 3.6% | 3.9% | 5.0% | 4.2% |
Source: Buenaventura
SRK Consulting (Peru) S. A. | May, 2022 |
SRK Consulting Peru SA SEC Technical Report Summary – El Brocal | Page 79 |

Figure 10-10: Plant 2´s Overall Performance
Source: Buenaventura
The daily performance of the lead-zinc plant (Plant 2) in terms of fresh feed and grinding product (P80) is shown on Figure 10-7. Figure 10-8 shows tonnage as a function of P80. It is evident that a significant variation in tonnage and P80 occurs from day to day. The tonnage v/s P80 relationship also shows a highly variable operation, which suggests that operating and process controls are inadequate.
Around July 2019, Plant 2’s grinding P80 values appear to repeat while the tonnage varied significantly. This suggests improper metallurgical accounting and/or errors when sampling, measuring, and recording operational variables. It is noteworthy that this same pattern was observed from Plant 1 starting around the same dates.

Figure 10-11: Plant 2 – Daily Performance – Throughput and Grinding P80
Source: Buenaventura
SRK Consulting (Peru) S. A. | May, 2022 |
SRK Consulting Peru SA SEC Technical Report Summary – El Brocal | Page 80 |

Figure 10-12: Plant 1, Throughput versus Grinding P80
Source: Buenaventura
Metallurgical Testing |
El Brocal provided metallurgical test results to SRK from around 2019. The testing included a total of 50 samples sourced from multiple locations in Marcapunta and Tajo Norte. The vast majority of these samples were subject to batch flotation and the remainder to locked cycle tests.
An additional 11 composite samples, which represented ore to be mined in the 2022 to 2032 period from Marcapunta and Tajo Norte deposits (according to the LOM 2021), were subject to flotation testing and mineralogical analysis with third party laboratories based in Lima, Peru. The location of these samples is shown in Figure 10-13.

Figure 10-13: Metallurgical Testing 2021, Sample´s Location
Source: Buenaventura
SRK Consulting (Peru) S. A. | May, 2022 |
SRK Consulting Peru SA SEC Technical Report Summary – El Brocal | Page 81 |
Overall, the mineralogical analysis shows that the composition of Marcapunta samples is comparable to that of the previous year’s feed; in other words, Enargite will continue to be the dominant copper-bearing mineral at roughly 80% while the presence of other copper sulfides will continue to be minor. Figure 10-14 and Figure 10-15 shows Marcapunta’s samples and the composition of its minerals. Note the wide range of minerals and their metal composition, which includes lead, bismuth, vanadium and antimony. El Brocal reports no bismuth, vanadium, antimony in its final concentrate.

Figure 10-14: Marcapunta, 2021 Composite’s Mineral Composition
Source: Buenaventura
Figure 10-15: Marcapunta, 2021 Composite´s Overall Mineral Composition
Source: Buenaventura
The 2019 testing campaign included a total of 102 rougher batch flotation tests performed on copper ore. See Figure 10-16, which depicts the following results:
| ● | Copper recovery ranged between 80% to 95% in approximately 66 out of 102 tests (or 65%) |
SRK Consulting (Peru) S. A. | May, 2022 |
SRK Consulting Peru SA SEC Technical Report Summary – El Brocal | Page 82 |
| ● | Gold recovery ranged between 15% and 30% in approximately 50% of the tests; the remaining tests yield gold recoveries typically below 5%. Only 74 tests included gold assays. |
| ● | Silver recovery shows a bimodal pattern with one peak roughly matching the one for copper at around 85% recovery; the other peak matches the one for gold at approximately 25% recovery. |
| ● | Overall, metal recovery results roughly approximate those achieved at industrial scale. Given the nature and purpose of this batch flotation test, it is expected that El Brocal will continue executing these tests on a regular basis to optimize and support the industrial-scale operation. |

Figure 10-16: Marcapunta, 2021 Composite’s Mineral Composition
Source: Buenaventura
In terms of Tajo Norte, galena and sphalerite continue to be the principal bearers of lead and zinc metal respectively; see Figure 10-17 and Figure 10-18. Chalcopyrite and pyrite are pervasive in all samples, and preferentially associated with pyrite and gangue.
SRK Consulting (Peru) S. A. | May, 2022 |
SRK Consulting Peru SA SEC Technical Report Summary – El Brocal | Page 83 |

Figure 10-17: Tajo Norte Mineralogical Composition
Source: Buenaventura

Figure 10-18: Tajo Norte, 2021 Composite’s Overall Mineral Composition
Source: Buenaventura
Conclusions and Recommendations |
Data available to SRK covered the period form 2017 until 2020. Figures for 2020 show a number of anomalies and erratic behavior, which are attributable to the negative impacts on the industry from unforeseen external factors. The figures from 2020 are, in general, excluded or considered unrepresentative of normal operations for the purposes of this document.
El Brocal’s Marcapunta underground mine’s ore production for the period in question shows monthly values ranging from 2.5 to 2.8 million tonnes per year averaging approximately 1.88% Cu with a minimum of 1.63% Cu and 2.32% Cu maximum. Arsenic averaged 0.61%, with a minimum of 0.53% and a maximum of 0.75%. Gold averaged 0.54 g/tonne with low of 0.40 g/tonne and high of 0.80 g/tonne. Copper and iron head grades suggest a slight upward trend that began in 2018; nevertheless, 2020’s anomalies may be biasing this observation and need to be confirmed with data from future years. Ninety-three percent (93%) of Marcapunta’s total production of ore tonnes was classified as copper-silver rich ore and delivered to Plant 1; the balance of approximately 7% fed Plant 2. Overall, Marcapunta represented only 6% of Plant 2’s total throughput.
SRK Consulting (Peru) S. A. | May, 2022 |
SRK Consulting Peru SA SEC Technical Report Summary – El Brocal | Page 84 |
In 2017-2020, Marcapunta’s ore production shows a 4% tonnes difference with the mill feed tonnes as declared by the processing facilities. While each plant likely controls all processes based on its own measurements, SRK questions whether the performance parameters (planned and actual tonnage, grades, and cost) declared by Marcapunta mine are accurate, which impacts mine planning and the steady supply of fresh ore to the mills.
If we exclude 2020’s figures, Plant 1’s operating time averaged 88.8%, which is equivalent to 339 t/hour or 8,143 t based on 24 hours per day. SRK is of the opinion that processing facilities like Plant 1 should operate in the 90% to 95% range, or even higher. SRK also believes it is in El Brocal’s best interest to identify those bottlenecks in the ore supply end and within Plant 1 itself that are preventing improvements in operating time. Removing bottlenecks will lower unit costs; improve overall stability; and allow better control the key operating parameters in the plant.
Copper Concentrate 1 production bearing silver values represent the largest fraction or approximately 99.6% of the approximately 180,000 tonnes/year produced; the balance or 0.4% was Copper Concentrate 2 without no declared silver content.
Plant 1‘s concentrate grades are reasonably steady; copper averaged 25.5% for Copper Concentrate 1 and 24.9% for Copper Concentrate 2. Arsenic in concentrate is high, ranging from 8% to 8.5% for both products. This more than likely makes it difficult to sell these products in open market and also tends to trigger high penalty payments. SRK did not have access to historical information regarding arsenic’s impact on the concentrate valuation; therefore, SRK was unable to offer a supported opinion about the quality of copper concentrates or the suitability of operating practices, including mine planning, and processing as well as the shipability and saleability of the production. In general, the concentrate smelting industry’s approach to deleterious elements contained in concentrates has been to continuously decrease the grades’ threshold; these triggers penalties; increases penalties; and lowers the grade cap or maximum acceptable content. Potentially, if experience with other deleterious metals is replicated, limits may be place on maximum transportable (allowed on ocean ships) deleterious metal contents. A way for mining operators to circumvent the deleterious metal’s environmental restrictions, which comes at a high cost, has been to sell its production to concentrate Traders that claim they blend multiple sources before shipping the blended concentrate to custom smelters around the globe.
Information available from mineralogical analysis on ore samples obtained in 2021 suggest the presence of bismuth, vanadium and antimony in Marcapunta; nevertheless, impurity specifications for final copper concentrate only include arsenic. Precious metals in Concentrate 1 include silver grading 6.74 oz/t average and gold at 3.6 grams per tonne.
Plant 1’s daily throughput and grinding product size (P80) is highly variable from one day to the next. It is SRK’s experience that Plant 1’s current performance negatively impacts the metallurgical performance and operating cost, and that El Brocal has an opportunity to materially improve its operating results. Additionally, starting in July 2019, both Plant 1 and Plant 2 show similar pattern of repeating the same grinding P80 for several consecutives’ days even though the corresponding ore throughput varied significantly. In SRK’s opinion, this is a highly anomalous occurrence, and it is in El Brocal’s best interest to identify the root cause of this behavior.
El Brocal needs to improve its metallurgical testing protocols to include a standard flotation test (kinetics flotation test, locked cycle tests), whose results can be easily scaled up and correlated to the current industrial operational results.
A sound operating philosophy that will contribute to the continuous improvement of El Brocal’s business results should consider the metallurgical group using laboratory testing results to define the operating conditions for each and every ore type or zone to be processed in the industrial scale
SRK Consulting (Peru) S. A. | May, 2022 |
SRK Consulting Peru SA SEC Technical Report Summary – El Brocal | Page 85 |
operation. The operating personnel must comply with and be accountable for following all metallurgical definitions received. The maintenance group must be accountable for delivering all equipment and systems to ensure that the floor personnel is able to smoothly operate the plant and deliver the expected results as defined by the metallurgical group. El Brocal´s management must be accountable for ensuring each group has the resources and performs as previously described. The plant must provide daily feedback of its performance to the geology and mine planning groups, thus closing a cycle that if executed correctly will continuously improve all performance indicators and business value for El Brocal.
El Brocal may want to integrate key daily data from geology, mining, processing, laboratory, sales in a single and comprehensive operating database. SRK recommends that this Operating Database should not be editable once data has been entered and all reports, analysis, summaries, etc must be sourced from the single Operating Database. Data should be readily available/accessible to all key personnel.
The reconciliation analysis between mine and mill could not be verified.
SRK Consulting (Peru) S. A. | May, 2022 |
SRK Consulting Peru SA SEC Technical Report Summary – El Brocal | Page 86 |
Mineral Resources Estimates |
Key Assumptions, Parameters, and Methods used |
The Mineral Resources estimation was conducted jointly by SRK and Buenaventura. The closure date of the database was on October 31, 2021, and the effective date to report the Mineral Resources was on December 3, 2021.
El Brocal Mine has open pit and underground operations of 3 zones which are: Tajo Norte, Tajo Sur and Marcapunta, generating only one resource model for all the deposit.
This section describes the Mineral Resources estimation method and summarizes the key assumptions that were considered for each deposit by El Brocal.
Software such as Vulcan ©, Supervisor® and Leapfrog Geo® were used to develop the geological model, the geostatistic analysis, the block model construction, the ore grade interpolation of copper, zinc, lead, silver, gold and iron, apart from the model validation and the resource reporting.
In general, to conduct the resource estimation process, a series of steps were made by BVN and SRK, according to the following order:
| ● | Database compilation and verification |
| ● | Revision of the interpretation and construction of the geological models or wireframes, |
| ● | Definition of domains, |
| ● | Compositing and capping for the geostatistical analysis and interpolation |
| ● | Analysis and modelling of variograms |
| ● | Grade interpolation of Cu, Pb, Zn, Au, Ag and Fe |
| ● | Assignment of density values |
| ● | Validation of grade estimates against original data |
| ● | Resource classification |
| ● | Conciliation of mineral |
| ● | RPEE |
The following sections describe all the procedures used and the assumptions that were considered for estimating the Mineral Resources.
Database |
The database used for the update of the Mineral Resources and El Brocal geological model is composed of 3,685 diamond drillings (453,464.5 meters) and 3 air reverse circulation drillholes (RC) (668 m) and includes information of collar, survey, assay, lithology, density, mineralization, alteration and mine zone. All the information was provided by Buenaventura in digital format in csv and represents all the data up to October 31, 2021. The statistics of the original samples used in the resource estimation is summarized in Table 11-1.
Table 11-1: Statistics of the El Brocal Original Data
Element | Samples | Mean | Minimum | Máximum | CV | Std. Dev | |
|---|---|---|---|---|---|---|---|
El Brocal | Cu % | 200,087 | 0.569 | 0.000025 | 37.10 | 2.61 | 1.484 |
Zn % | 191,089 | 0.639 | 0.000010 | 40.10 | 2.91 | 1.860 | |
| PB % | 190,657 | 0.286 | 0.000025 | 55.20 | 3.55 | 1.014 |
SRK Consulting (Peru) S. A. | May, 2022 |
SRK Consulting Peru SA SEC Technical Report Summary – El Brocal | Page 87 |
Deposit | Element | Samples | Mean | Minimum | Máximum | CV | Std. Dev |
|---|---|---|---|---|---|---|---|
| Ag oz/t | 217,021 | 0.661 | 0.000161 | 809.09 | 5.52 | 3.644 |
| Au ppm | 168,399 | 0.347 | 0.002500 | 58.80 | 2.11 | 0.733 |
| Fe% | 200,414 | 12.775 | 0.005000 | 55.20 | 0.82 | 10.433 |
| As % | 163,769 | 0.206 | 0.000005 | 14.04 | 2.63 | 0.542 |
Source: Buenaventura, 2021
Geological Model and Estimation Domains |
The geological models developed in El Brocal were constructed in order to have a better knowledge of the deposit geology, understand all the aspects that control the mineralization and provide support to the Mineral Resources model.
The geological modelling in 3D includes a lithology model to characterize the geological bodies, a mineral zone to characterize the oxidized material, a structural model and a mineralization model through the construction of the envelops of isogrades to identify and segregate domains through cut-off grades.
The models were developed in Leapfrog Geo (v 2021.1) and incorporated different geological information that was based on:
● Geological logging (alteration, lithology and mineralization)
● Geological mapping
● Cross sections interpreted
● Structural surface observations / diamond drill cores
● Polylines interpreted (3D Surface and sub-surface)
Lithological and Structural Model |
The lithological model was developed by Buenaventura with Leapfrog Geo in 2020 based on a new geological mapping at 1:1000 scale that included alteration, mineralization, lithological and structural maps. Also, historical data (since 1993) was also compiled and used for providing greater support to the model; together with a mapping inside the mine, interpretation of cross and digitalized sections, and all the diamond drillholes information. In addition, an updated stratigraphic column was conducted in El Brocal based on the results of these works.
Buenaventura has defined 10 lithological units: Mitu, Conglomerado Shuco, Conglomerado Transicional, Calera Inferior (Cal_Inf), Calera Medio Favorable (Cal_Mid_Fav), Calera Medio Varvada (Cal_Mid_Var), Calera Superior (Cal_Sup), Deposito Piroclástico (Dep_piro), Dacita Porfirítica (Dac_Porf) and Brecha (Bx). The 3D view of the lithological model is shown in Figure 11-1.
SRK Consulting (Peru) S. A. | May, 2022 |
SRK Consulting Peru SA SEC Technical Report Summary – El Brocal | Page 88 |
Figure 11-1: 3D View of El Brocal Lithological Model
Source: Buenaventura, 2021
The structural model was developed by SRK in 2019 and by Buenaventura in 2020. In 2019, SRK was commissioned by Buenaventura to conduct a structural study and modelling in the north part of the deposit (North Pit).
In 2020, Buenaventura continued with the studies to complement and integrate the structural model of the whole deposit of the mid and southern area (Smelter and Marcapunta) and the information update of the northern area, conducting structural study works that includes structural mapping in surface at 1:1000 scale, collection of all the historical information from diamond drillholes, and mapping in underground mine, and also interpretation support of cross and digitalized sections. All the work was completed in the first quarter of 2021 with the construction of the structural model and the integration of a global structural model. SRK revised the study and structural model during all the construction process.
SRK it is of the opinion that the northern area of El Brocal has a detailed study and information in sufficient quantity, confidence and support for considering the model at feasibility level. However, the southern area needs greater detail and information support to define the confidence in the fault modeling and the control that these faults have in the mineralization. Therefore, regarding the southern area, SRK considers that the model is at conceptual level. According to a communication with Buenaventura, new structural works will be conducted in the first quarter of 2022 to provide robustness and confidence to the structural model in the southern area.
The modelling of the major faults that control the stratigraphy and mineralization in El Brocal is shown in Figure 11-2.
SRK Consulting (Peru) S. A. | May, 2022 |
SRK Consulting Peru SA SEC Technical Report Summary – El Brocal | Page 89 |

Figure 11-2: 3D View of El Brocal Modeled Structures
Source: Buenaventura, 2021 (Buenaventura, 2021)
Grade Shells and Domaining |
SRK constructed grade envelops at different cut-off grades inside each lithological unit in Leapfrog Geo using the tool New Indicator RBF Interpolant in order to define the estimation domains. The cut-off grades were defined statistically to separate zones in terms of spatial variability and reflects the differences in the continuity of the grades in each unit.
The grade envelops (grade shells) were constructed for each copper, lead, zinc, silver, gold and iron element, taking into account the following: a sample compositing at 2 m along the drillhole within the lithological unit, structural trends, probability factors (iso-value) between 40% and 45% to ensure continuity, a variation coefficient lower than 2.5 and evaluation of the relative dilution above and below the cut-off grades in each envelop.
SRK and Buenaventura considered that an additional zoning was necessary to control the high grades within the upper domain defined and prevent overestimation in the grade interpolation, delimiting intermediate and low-grade zones. Zones below the intermediate cut-off grades were used in all the units as low-grade domains.
SRK used the following cut-off grades to define the following intermediate and high-grade domains as follows:
● Cut-off grades Cu>0.5 % for intermediate-grade zones and Cu >1.8 % for high grade.
● Cut-off grades Zn>0.1 % for intermediate-grade zones and Zn >1.5 % for high grade.
SRK Consulting (Peru) S. A. | May, 2022 |
SRK Consulting Peru SA SEC Technical Report Summary – El Brocal | Page 90 |
● Cut-off grades Pb>0.05 % for intermediate-grade zones and Pb >1. % for high grade.
● Cut-off grades Ag>0.32 oz/t for intermediate-grade zones and Ag >1 oz/t for high grade.
● Cut-off grades Au > 0.1 % for intermediate-grade zones and Au > 0.8 ppm for high grade
● Cut-off grades Fe > 8 % to define high-grade zones.
Finally, the estimation domains were defined using the grade shells within each of the ten lithological units for each element. Contact analysis was conducted to validate the consistency in the domain division and a “hard contact” was used during the interpolation to prevent influence of samples among domains. Table 11-2 shows the domains and codes used in the estimation for Cu, Pb, Ag, Zn, Fe and Au; and summaries the volume thar each lithology represents.
Table 11-2: El Brocal domains used in the estimation.
Source: SRK, 2021 (SRK, 2021)
A 3D view of the grade shells for zinc within the lithological unit (Cal_Mid_Fav) “Calera Media Favorable” is shown in Figure 11-3, and a structural section of the same domain is shown in Figure 11-4.
Tables as Table 11-3 were prepared in the construction of grade shells to ensure an acceptable model through the statistics and relative dilution
SRK Consulting (Peru) S. A. | May, 2022 |
SRK Consulting Peru SA SEC Technical Report Summary – El Brocal | Page 91 |

Figure 11-3: 3D View of medium-grade envelop (yellow) and High-grade (red) within the “Calera Medio Favorable” Unit (Cal_Mid_Fav).
Source: SRK, 2021 (SRK, 2021)

Figure 11-4: Cross Section of the Zinc Grade Envelop in domain cal_mid_fav
(high grade: red, and medium grade: yellow)
Source: SRK, 2021 (SRK, 2021)
Table 11-3: Statistics of Zinc Grade Shell Model Indicators
Indicator statistics: Zinc – (Calera Media Favorable: Cal_Mid_Fav) | ||||
Total number of samples | 38,259 | Total number of samples | 19,007 | |
Cut-off value (%) | 0.1 | Cut-off value (%) | 1.5 | |
≥ cut-off | ≥ cut-off | |||
SRK Consulting (Peru) S. A. | May, 2022 |
SRK Consulting Peru SA SEC Technical Report Summary – El Brocal | Page 92 |
Indicator statistics: Zinc – (Calera Media Favorable: Cal_Mid_Fav) | ||||
Number of points | 19,070 | Number of points | 9,353 | |
Percentage | 49.84% | Percentage | 49.21% | |
Mean value (%) | 2.1314 | Mean value (%) | 3.65029 | |
Minimum value (%) | 0.1 | Minimum value (%) | 1.5 | |
Maximum value (%) | 26.4131 | Maximum value (%) | 25.835 | |
Standard deviation | 2.42426 | Standard deviation | 2.68422 | |
Coefficient of variance | 1.1374 | Coefficient of variance | 0.735343 | |
Variance | 5.87704 | Variance | 7.20503 | |
Output volume statistics | Output volume statistics | |||
Resolution | 10 | Resolution | 5 | |
Iso-value | 0.45 | Iso-value | 0.4 | |
Inside | Inside | |||
≥ cut-off | ≥ cut-off | |||
Number of samples | 18,429 | Number of samples | 8,998 | |
Percentage | 48.17% | Percentage | 47.34% | |
< cut-off | < cut-off | |||
Number of samples | 1,335 | Number of samples | 1,075 | |
Percentage | 3.49% | Percentage | 5.66% | |
6.80% | 10.70% | |||
All points | All points | |||
Mean value (%) | 2.0464 | Mean value (%) | 3.39957 | |
Minimum value (%) | 0.0001 | Minimum value (%) | 0.0001 | |
Maximum value (%) | 26.4131 | Maximum value (%) | 2.58E+01 | |
Standard deviation | 2.41863 | Standard deviation | 2.71638 | |
Coefficient of variance | 1.18189 | Coefficient of variance | 0.799038 | |
Variance | 5.84978 | Variance | 7.37875 | |
Volume (m³) | 85,404,211 | Volume (m³) | 40,828,777 | |
Number of parts | 20 | Number of parts | 14 | |
Source: SRK, 2021 (SRK, 2021)
Exploratory Data Analysis |
The exploratory data analysis (EDA) was conducted by Buenaventura in the composites identified for each domain. The statistical and graphic analysis was performed (including histograms, probability diagrams, scatter plots) for each domain in order to evaluate an adequate stationarity.
Compositing and Capping |
Buenaventura reviewed cumulative probability plots of the original sample data without compositing to evaluate the grade population with presence of outliers values inside each estimation domain. Grade capping was necessary in order to control the over-estimation effects at local level on the interpolation process. Capping is carried out to the original samples before the compositing process.
SRK Consulting (Peru) S. A. | May, 2022 |
SRK Consulting Peru SA SEC Technical Report Summary – El Brocal | Page 93 |
The analysis was based in the visual interpretation of the probability plot structure by observing the appropriate inflection points at the end of the populations and that this does not generate a significant percentage of metallic content loss.
The capping values that were assigned to each domain according to the evaluation is summarized in Table 11-4.
An example of the cumulative probability plots and top-cut analysis for Pb element within the most important domains of the deposit are shown in Figure 11-5 and Table 11-5 summarizes a comparison between statistics before and after capping (silver, iron and gold see in appendix)
Table 11-4: Cu, Pb and Zn Capping Values Applied in El Brocal.
Mine | Domain | Cu (%) | Pb (%) | Zn (%) |
EL BROCAL | 11 | 3.5 | 0.5 | 0.32 |
12 | 12.5 | 3.2 | NC | |
13 | 11.65 | NC | NC | |
21 | 4 | 3 | 5 | |
22 | 11 | 4 | 5 | |
23 | 13.5 | NC | 7 | |
31 | 4.5 | 0.4 | 3.5 | |
32 | 12 | 4.5 | 12 | |
33 | 22 | 30 | 25 | |
41 | 3 | 0.35 | 4 | |
42 | 10 | 5 | 4.5 | |
43 | NC | 5.5 | 16 | |
51 | 5 | 2 | 8.5 | |
52 | NC | 3.2 | 7 | |
53 | NC | 9.4 | 20 | |
61 | 5.3 | 0.25 | 2.5 | |
62 | 13 | 1.2 | 7 | |
63 | 30 | NC | 15 | |
71 | 5 | 0.25 | 4.5 | |
72 | 16 | 1.1 | 7.5 | |
73 | 18 | NC | 10 | |
81 | 7 | 0.7 | 4 | |
82 | 16 | 2 | 1.5 | |
83 | 17 | NC | NC | |
91 | 5 | 0.38 | 0.5 | |
92 | NC | NC | NC | |
93 | NC | NC | NC | |
101 | 9 | 0.4 | 2 | |
102 | 12 | 1.75 | 1.85 | |
103 | 10 | NC | NC |
Source: SRK, 2021 (SRK, 2021)
Note: NC = Not capped
SRK Consulting (Peru) S. A. | May, 2022 |
SRK Consulting Peru SA SEC Technical Report Summary – El Brocal | Page 94 |

Figure 11-5: Top-Cut analysis of Pb in domain 32.
Source: SRK, 2021 (SRK, 2021)
Table 11-5: Statical comparison before and after capping of Pb in domain 32 (Capping: 4.5%)
Source: SRK, 2021 (SRK, 2021)
SRK Consulting (Peru) S. A. | May, 2022 |
SRK Consulting Peru SA SEC Technical Report Summary – El Brocal | Page 95 |
After the capping process, the length-weighted compositing was obtained to ensure the ore grade standardization of the samples along the drillhole within each domain modeled. To determine the composite, Buenaventura evaluated different scenarios of the composites size in each lithology and obtained the most appropriate composite value for the deposit. The sample compositing size determined by Buenaventura was 2 m with 1-m tolerance. Table 11-6 SRK evaluated the compositing by comparing the Cu statistics (%) without weighting, directly composited versus the Au statistics with length-weighted compositing. SRK verified that there is no significant bias in the mean after the compositing. Table 11-7 shows the statistics of the composited data samples considered in Cu estimation domains. The statistics of the other elements and domains are provided in the Appendix.
Table 11-6: Statistical comparison between uncomposited data and composited data for copper (%) in domain 3.
Domain code | Statistics | Uncomposited | Composited | Difference % |
31 | Samples | 49,749 | 34,009 | 31. |
| Minimum | 0.0001 | 0.0001 | 0.0 |
| Maximum | 4.500 | 4.500 | 0.0 |
| Mean | 0.032 | 0.027 | 14.8 |
| Variance | 0.025 | 0.013 | 45.5 |
| Std. Dev. | 0.157 | 0.116 | 26.2 |
| CV | 4.941 | 4.278 | 13.4 |
32 | Samples | 9,780 | 6,781 | 30.7 |
| Minimum | 0.001 | 0.001 | 0.0 |
| Maximum | 12.000 | 12.000 | 0.0 |
| Mean | 0.946 | 0.911 | 3.8 |
| Variance | 1.483 | 0.854 | 42.4 |
| Std. Dev. | 1.218 | 0.924 | 24.1 |
| CV | 1.287 | 1.015 | 21.2 |
33 | Samples | 2,929 | 2,117 | 27.7 |
| Minimum | 0.001 | 0.001 | 0.0 |
| Maximum | 22.000 | 22.000 | 0.0 |
| Mean | 3.925 | 3.856 | 1.8 |
| Variance | 11.848 | 7.182 | 39.4 |
| Std. Dev. | 3.442 | 2.680 | 22.1 |
| CV | 0.877 | 0.695 | 20.8 |
Source: SRK, 2021 (SRK, 2021)
Table 11-7: Summary of statistics composited data in main domains for copper, zinc and lead.
Metal | Domain | Samples | Mean | Minimum | Maximum | Variance | Std. Dev | CV |
|---|---|---|---|---|---|---|---|---|
Cu (%) | 61 | 15,598 | 0.120 | 0.0001 | 5.300 | 0.040 | 0.201 | 1.676 |
| 62 | 19,895 | 0.873 | 0.001 | 13.000 | 0.746 | 0.864 | 0.989 |
| 63 | 3,328 | 4.323 | 0.001 | 29.030 | 13.229 | 3.637 | 0.841 |
| 71 | 9,753 | 0.092 | 0.0001 | 5.000 | 0.037 | 0.191 | 2.082 |
| 72 | 8,661 | 1.003 | 0.001 | 15.131 | 1.332 | 1.154 | 1.150 |
| 73 | 412 | 4.335 | 0.001 | 18.000 | 10.464 | 3.235 | 0.746 |
Pb (%) | 31 | Pb | 15,689 | 0.0001 | 0.400 | 0.011 | 0.001 | 0.023 |
| 32 | Pb | 23,617 | 0.001 | 4.500 | 0.297 | 0.153 | 0.391 |
SRK Consulting (Peru) S. A. | May, 2022 |
SRK Consulting Peru SA SEC Technical Report Summary – El Brocal | Page 96 |
Metal | Domain | Samples | Mean | Minimum | Maximum | Variance | Std. Dev | CV |
|---|---|---|---|---|---|---|---|---|
| 33 | Pb | 3,597 | 0.001 | 24.790 | 2.514 | 5.427 | 2.330 |
| 61 | Pb | 14,190 | 0.0001 | 0.250 | 0.019 | 0.000 | 0.018 |
| 62 | Pb | 24,273 | 0.001 | 1.763 | 0.145 | 0.018 | 0.135 |
Zn (%) | 31 | Zn | 21,934 | 0.001 | 3.500 | 0.040 | 0.038 | 0.194 |
| 32 | Zn | 10,257 | 0.001 | 8.831 | 0.606 | 0.449 | 0.670 |
| 33 | Zn | 10,746 | 0.001 | 23.975 | 3.259 | 7.713 | 2.777 |
| 61 | Zn | 36,837 | 0.0001 | 2.455 | 0.015 | 0.004 | 0.061 |
| 62 | Zn | 1,345 | 0.001 | 6.586 | 0.475 | 0.516 | 0.719 |
| 63 | Zn | 150 | 0.001 | 15.000 | 3.979 | 13.288 | 3.645 |
Source: SRK, 2021 (SRK, 2021)
Continuity Analysis: Variogram |
SRK conducted the continuity analysis and spatial correlation of the grade values between simple sample pairs within each domain to determine the greatest spatial continuity axis. Variograms were built by using spherical type structures. There is not enough data in some domains to conduct an appropriate variogram modelling. In that case, domains were clustered into the same lithological unit to complete the analysis.
Some of the variograms modelled in the most important Cu, Pb, and Zn domains are shown in Figure 11-6, Figure 11-7 and Figure 11-8, respectively (for all domains and elements see the appendix).

Figure 11-6: Cu Modeled Variogram within Domain 62/63.
Source: SRK, 2021 (SRK, 2021)
SRK Consulting (Peru) S. A. | May, 2022 |
SRK Consulting Peru SA SEC Technical Report Summary – El Brocal | Page 97 |

Figure 11-7: Zn Modeled Variogram within Domain 32/33.
Source: SRK, 2021
Figure 11-8: Pb Modeled Variogram within Domain 52/53.
Source: SRK, 2021 (SRK, 2021)
Variograms (spherical type) in main mineralized mantles and by copper, zinc and lead are summarized in Table 11-8. This table shows the variograms parameters and direction were used
SRK Consulting (Peru) S. A. | May, 2022 |
SRK Consulting Peru SA SEC Technical Report Summary – El Brocal | Page 98 |
in the grade estimation of each block conducted by SRK. The rest of the variogram parameters for each element and domain are found in appendixes.
SRK Consulting (Peru) S. A. | May, 2022 |
SRK Consulting Peru SA SEC Technical Report Summary – El Brocal | Page 99 |
Table 11-8: Summary of Cu, Pb and Zn Variogram Model Parameters
Metal | Domain | Nugget | Structure count | Sill 1 | Bearing 1 | Plunge 1 | Dip 1 | Major 1 | Semi major 1 | Minor 1 | Sill 2 | Bearing 2 | Plunge 2 | Dip 2 | Major 2 | Semi major 2 | Minor 2 |
Cu | 63 | 0.212 | 2 | 0.48 | 358.49 | 29.50 | 5.73 | 4 | 3 | 3 | 0.31 | 358.49 | 29.499 | 5.725 | 26 | 49 | 23 |
| 71 | 0.212 | 2 | 0.53 | 0 | 0 | -30 | 7 | 7 | 23 | 0.26 | 0 | 0 | -30 | 52 | 111 | 61 |
| 72 | 0.212 | 2 | 0.53 | 0 | 0 | -30 | 7 | 7 | 23 | 0.26 | 0 | 0 | -30 | 52 | 111 | 61 |
| 73 | 0.212 | 2 | 0.53 | 0 | 0 | -30 | 7 | 7 | 23 | 0.26 | 0 | 0 | -30 | 52 | 111 | 61 |
Pb | 31 | 0.164 | 2 | 0.54 | 130.15 | 1.73 | -9.85 | 47 | 29 | 12 | 0.29 | 130.15 | 1.73 | -9.85 | 400 | 580 | 120 |
| 32 | 0.164 | 2 | 0.54 | 130.15 | 1.73 | -9.85 | 47 | 29 | 12 | 0.29 | 130.15 | 1.73 | -9.85 | 400 | 580 | 120 |
| 33 | 0.164 | 2 | 0.54 | 130.15 | 1.73 | -9.85 | 47 | 29 | 12 | 0.29 | 130.15 | 1.73 | -9.85 | 400 | 580 | 120 |
| 61 | 0.135 | 2 | 0.65 | 31.52 | 9.85 | -17.5 | 10 | 15 | 27 | 0.22 | 31.52 | 9.85 | -17.50 | 300 | 350 | 120 |
| 62 | 0.135 | 2 | 0.65 | 31.52 | 9.85 | -17.5 | 10 | 15 | 27 | 0.22 | 31.52 | 9.85 | -17.50 | 300 | 350 | 120 |
Zn | 31 | 0.13 | 2 | 0.53 | 250 | 10 | 0 | 19 | 27 | 7 | 0.34 | 250 | 10 | 0 | 90 | 154 | 33 |
| 32 | 0.13 | 2 | 0.53 | 250 | 10 | 0 | 19 | 27 | 7 | 0.34 | 250 | 10 | 0 | 90 | 154 | 33 |
| 33 | 0.13 | 2 | 0.53 | 250 | 10 | 0 | 19 | 27 | 7 | 0.34 | 250 | 10 | 0 | 90 | 154 | 33 |
| 61 | 0.155 | 2 | 0.62 | 220 | 0 | 0 | 21 | 15 | 7 | 0.22 | 220 | 0 | 0 | 116 | 134 | 73 |
| 62 | 0.155 | 2 | 0.62 | 220 | 0 | 0 | 21 | 15 | 7 | 0.22 | 220 | 0 | 0 | 116 | 134 | 73 |
| 63 | 0.155 | 2 | 0.62 | 220 | 0 | 0 | 21 | 15 | 7 | 0.22 | 220 | 0 | 0 | 116 | 134 | 73 |
Source: SRK, 2021 (SRK, 2021)
SRK Consulting (Peru) S. A. | May, 2022 |
SRK Consulting Peru SA SEC Technical Report Summary – El Brocal | Page 100 |
Mineral Resources Estimates |
The Mineral Resources estimation was completed using Vulcan. It considered all the composited and capped samples, the estimation domains and the continuity analysis previously conducted.
Block Model |
Buenaventura constructed a block model for grade interpolation using Vulcan software. The block model covers the lithological model and include all the pit zone and the current underground workings. The model does not have rotation and therefore the X, Y and Z axis follow the East–West, North-South and elevation directions; and is blocked with 8x8x6 parent cell. The characteristics of El Brocal block model are summarized in Table 11-9.
Table 11-9: Brocal Block Model detail.
Model | Direction | Minimum | Maximum | Block Size | No of |
Source: Buenaventura, 2021 (Buenaventura, 2021)
Grade Interpolation and parameters |
The estimation parameters were defined based on neighbor analysis (QKNA) in Supervisor. In some domains, the estimation included a grade spherical restriction to the sample influence (outlier restriction). Generally, the sphere influence may include one or more blocks located near the sample with restricted grade. Outside this influence volume, the sample grade is delimited.
The methodology and the resource estimation process consisted in:
| ● | All the domains were estimated with Ordinary Kriging and the Nearest Neighbor (NN) method in order to validate the model. |
| ● | An estimation plan with 4 passes in the search radius and 3x3x3 discretization |
| ● | The hard contacts were applied among the domains. In that way, every mineralized solid was estimated with the composites that are located inside the domain solid under evaluation. |
| ● | In all the zones, the angles are controlled by dynamic anisotropy. The Dynamic anisotropy used during Kriging is useful for aligning both the variographic model and the search ellipsoid. |
| ● | The minimum number of drillholes to estimate each block was 1 |
The Cu estimation parameters of the principal domains are summarized in Table 11-10.
SRK Consulting (Peru) S. A. | May, 2022 |
SRK Consulting Peru SA SEC Technical Report Summary – El Brocal | Page 101 |
Table 11-10: Cu, Pb and Zn Estimation Parameters
Metal | Domain | Pass | Search distances (m) | Rotation angles (°) | Sample counts | Sample Limits | |||||
Major axis | Semi | Minor | Rot 1 | Rot 2 | Rot 3 | Min | Max | Max samples per | |||
Cu | 61 | 1 | 30 | 30 | 12.5 | 358.49 | 29.50 | 5.73 | 3 | 10 | 2 |
2 | 60 | 60 | 25 | 358.49 | 29.50 | 5.73 | 3 | 10 | 2 | ||
3 | 120 | 120 | 50 | 358.49 | 29.50 | 5.73 | 3 | 10 | 2 | ||
4 | 240 | 240 | 100 | 358.49 | 29.50 | 5.73 | 1 | 8 | - | ||
62 | 1 | 30 | 30 | 12.5 | 358.49 | 29.50 | 5.73 | 3 | 10 | 2 | |
2 | 60 | 60 | 25 | 358.49 | 29.50 | 5.73 | 3 | 10 | 2 | ||
3 | 120 | 120 | 50 | 358.49 | 29.50 | 5.73 | 3 | 10 | 2 | ||
4 | 240 | 240 | 100 | 358.49 | 29.50 | 5.73 | 1 | 8 | - | ||
63 | 1 | 30 | 30 | 12.5 | 358.49 | 29.50 | 5.73 | 3 | 10 | 2 | |
2 | 60 | 60 | 25 | 358.49 | 29.50 | 5.73 | 3 | 10 | 2 | ||
3 | 120 | 120 | 50 | 358.49 | 29.50 | 5.73 | 3 | 10 | 2 | ||
4 | 240 | 240 | 100 | 358.49 | 29.50 | 5.73 | 1 | 8 | - | ||
71 | 1 | 30 | 30 | 10 | 0 | 0 | -30 | 3 | 10 | 2 | |
2 | 55 | 60 | 20 | 0 | 0 | -30 | 3 | 10 | 2 | ||
3 | 110 | 120 | 40 | 0 | 0 | -30 | 3 | 10 | 2 | ||
4 | 220 | 240 | 80 | 0 | 0 | -30 | 1 | 8 | - | ||
72 | 1 | 30 | 30 | 10 | 0 | 0 | -30 | 3 | 10 | 2 | |
2 | 55 | 60 | 20 | 0 | 0 | -30 | 3 | 10 | 2 | ||
3 | 110 | 120 | 40 | 0 | 0 | -30 | 3 | 10 | 2 | ||
4 | 220 | 240 | 80 | 0 | 0 | -30 | 1 | 8 | - | ||
73 | 1 | 30 | 30 | 10 | 0 | 0 | -30 | 3 | 8 | 2 | |
2 | 55 | 60 | 20 | 0 | 0 | -30 | 3 | 8 | 2 | ||
3 | 110 | 120 | 40 | 0 | 0 | -30 | 3 | 5 | 2 | ||
4 | 220 | 240 | 80 | 0 | 0 | -30 | 1 | 6 | - | ||
Pb | 31 | 1 | 45 | 35 | 10 | 130.15 | 1.73 | -9.85 | 3 | 8 | 2 |
2 | 90 | 70 | 20 | 130.15 | 1.73 | -9.85 | 3 | 10 | 2 | ||
3 | 135 | 105 | 30 | 130.15 | 1.73 | -9.85 | 3 | 12 | 2 | ||
4 | 180 | 145 | 40 | 130.15 | 1.73 | -9.85 | 1 | 14 | 2 | ||
32 | 1 | 45 | 35 | 10 | 130.15 | 1.73 | -9.85 | 3 | 14 | 2 | |
2 | 90 | 70 | 20 | 130.15 | 1.73 | -9.85 | 3 | 14 | 2 | ||
3 | 135 | 105 | 30 | 130.15 | 1.73 | -9.85 | 3 | 12 | 2 | ||
4 | 180 | 145 | 40 | 130.15 | 1.73 | -9.85 | 1 | 14 | 2 | ||
33 | 1 | 45 | 35 | 10 | 130.15 | 1.73 | -9.85 | 3 | 14 | 2 | |
2 | 90 | 70 | 20 | 130.15 | 1.73 | -9.85 | 3 | 14 | 2 | ||
3 | 135 | 105 | 30 | 130.15 | 1.73 | -9.85 | 3 | 14 | 2 | ||
4 | 180 | 145 | 40 | 130.15 | 1.73 | -9.85 | 1 | 14 | 2 | ||
SRK Consulting (Peru) S. A. | May, 2022 |
SRK Consulting Peru SA SEC Technical Report Summary – El Brocal | Page 102 |
61 | 1 | 50 | 50 | 10 | 31.52 | 9.85 | -17.50 | 3 | 12 | 2 | |
2 | 100 | 100 | 30 | 31.52 | 9.85 | -17.50 | 3 | 12 | 2 | ||
3 | 150 | 150 | 45 | 31.52 | 9.85 | -17.50 | 3 | 12 | 2 | ||
4 | 200 | 200 | 60 | 31.52 | 9.85 | -17.50 | 1 | 12 | 2 | ||
62 | 1 | 50 | 50 | 10 | 31.52 | 9.85 | -17.50 | 3 | 8 | 2 | |
2 | 100 | 100 | 30 | 31.52 | 9.85 | -17.50 | 3 | 10 | 2 | ||
3 | 150 | 150 | 45 | 31.52 | 9.85 | -17.50 | 3 | 10 | 2 | ||
4 | 200 | 200 | 60 | 31.52 | 9.85 | -17.50 | 1 | 12 | 2 | ||
Zn | | 1 | 30 | 53 | 10 | 250 | 10 | 0 | 3 | 10 | 2 |
2 | 60 | 106 | 20 | 250 | 10 | 0 | 3 | 10 | 2 | ||
3 | 90 | 159 | 30 | 250 | 10 | 0 | 3 | 10 | 2 | ||
4 | 120 | 212 | 40 | 250 | 10 | 0 | 1 | 10 | - | ||
| 1 | 30 | 53 | 10 | 250 | 10 | 0 | 3 | 10 | 2 | |
2 | 60 | 106 | 20 | 250 | 10 | 0 | 3 | 10 | 2 | ||
3 | 90 | 159 | 30 | 250 | 10 | 0 | 3 | 10 | 2 | ||
4 | 120 | 212 | 40 | 250 | 10 | 0 | 1 | 10 | - | ||
| 1 | 30 | 53 | 10 | 250 | 10 | 0 | 3 | 10 | 2 | |
2 | 60 | 106 | 20 | 250 | 10 | 0 | 3 | 10 | 2 | ||
3 | 90 | 159 | 30 | 250 | 10 | 0 | 3 | 10 | 2 | ||
4 | 120 | 212 | 40 | 250 | 10 | 0 | 1 | 10 | - | ||
| 1 | 54 | 52 | 14 | 220 | 0 | 0 | 3 | 12 | 2 | |
2 | 108 | 104 | 28 | 220 | 0 | 0 | 3 | 12 | 2 | ||
3 | 162 | 156 | 42 | 220 | 0 | 0 | 3 | 12 | 2 | ||
4 | 216 | 208 | 56 | 220 | 0 | 0 | 1 | 12 | - | ||
| 1 | 54 | 52 | 14 | 220 | 0 | 0 | 3 | 12 | 2 | |
2 | 108 | 104 | 28 | 220 | 0 | 0 | 3 | 12 | 2 | ||
3 | 162 | 156 | 42 | 220 | 0 | 0 | 3 | 12 | 2 | ||
4 | 216 | 208 | 56 | 220 | 0 | 0 | 1 | 12 | - | ||
| 1 | 54 | 52 | 14 | 220 | 0 | 0 | 3 | 12 | 2 | |
2 | 108 | 104 | 28 | 220 | 0 | 0 | 3 | 12 | 2 | ||
3 | 162 | 156 | 42 | 220 | 0 | 0 | 3 | 12 | 2 | ||
4 | 216 | 208 | 56 | 220 | 0 | 0 | 1 | 12 | - |
Source: SRK, 2021 (SRK, 2021)
SRK Consulting (Peru) S. A. | May, 2022 |
SRK Consulting Peru SA SEC Technical Report Summary – El Brocal | Page 103 |
Model Validation |
SRK verified the block model estimations through of different techniques included cross validation, visual inspection of the composites and the block grades, statistical comparison among composites and block model distributions, and also statistical comparison among estimations obtained with the nearest neighbor method, through swath plots.
Cross Validation
When defining the modeled variograms, the estimation and the search neighborhoods, there is a potential value range that can be established. In order to optimize these values, a cross validation was conducted. This technique implies excluding a sample point and estimating a rating instead by using the remaining compounds. This process is repeated for all the compounds that are used for the estimation, and the average grade estimated is compared versus the actual average ore grade of the compounds.
To establish the parameters that provide the most accurate result, a variety of estimation techniques, search neighborhood and variogram models were tested by using this method in El Brocal.
The cross-validation results confirmed that OK is a reasonable estimation method when there are enough data for variogram analysis (Figure 11-9). The cross validation also helped in the variogram adjustment and the neighborhood search parameters.
Figure 11-9: Cross Validation for Domain 42, 43 for Zinc.
Source: SRK, 2021 (SRK, 2021)
Visual Validation
SRK revised visually the block model through cross sections to ensure that the grade distribution in the blocks is consistent with the average composite grade.
SRK Consulting (Peru) S. A. | May, 2022 |
SRK Consulting Peru SA SEC Technical Report Summary – El Brocal | Page 104 |
The Cu grade distribution (%) in the drillholes and in the block model is shown in Figure 11-10. The consistency between the estimated grades and the composite grades can be observed in this figure.

Figure 11-10: Visual Validation of the Cu (%) Grade Model Versus the Grade in the Drillholes
Source: SRK, 2021 (SRK, 2021)
The Pb distribution grades (%) in the drillholes and in the block model are shown in Figure 11-11. The consistency between the estimated grades and the composite grades can be observed in this figure.
Figure 11-11: Visual Validation of the Pb (%) Grade Model Versus the Grade in the Drillholes
Source: SRK, 2021 (SRK, 2021)
The Zn grade distribution (%) in the drillholes and in the block model are shown in Figure 11-12. The consistency between the estimated grade and the composite grades can be observed in this figure.
SRK Consulting (Peru) S. A. | May, 2022 |
SRK Consulting Peru SA SEC Technical Report Summary – El Brocal | Page 105 |

Figure 11-12: Visual Validation of the Zn (%) Grade Model Versus the Grade in the Drillholes
Source: SRK, 2021 (SRK, 2021)
Global Estimation Validation
SRK used the Ordinary Kriging (OK) and the Nearest Neighbors (NN) models to validate the interpolation model and to verify the global grade bias of the blocks. The OK and NN grades were compared versus all the blocks estimated at a cut-off grade of zero. The result of this comparison is shown in Table 11-11, Table 11-12 and Table 11-13.
Table 11-11: Verification of the Global Bias in Cu Domains of El Brocal Mine
Domain | CU_OK | CU_NN | Difference |
|---|---|---|---|
11 | 0.12 | 0.11 | 14.4% |
12 | 0.91 | 0.90 | 0.6% |
13 | 3.30 | 3.20 | 3.0% |
21 | 0.01 | 0.01 | 12.8% |
22 | 1.00 | 1.05 | -4.9% |
23 | 3.79 | 3.66 | 3.5% |
31 | 0.02 | 0.02 | -2.3% |
32 | 0.89 | 0.89 | 0.6% |
33 | 3.86 | 3.82 | 1.1% |
41 | 0.00 | 0.00 | 2.4% |
42 | 1.10 | 0.99 | 9.8% |
43 | 4.29 | 3.68 | 14.2% |
51 | 0.00 | 0.00 | 5.1% |
61 | 0.05 | 0.05 | 3.5% |
62 | 0.82 | 0.80 | 2.2% |
63 | 4.21 | 4.19 | 0.5% |
71 | 0.02 | 0.02 | 4.3% |
72 | 0.93 | 0.93 | 0.5% |
73 | 4.71 | 4.81 | -2.1% |
81 | 0.02 | 0.02 | 2.1% |
82 | 0.89 | 0.86 | 3.6% |
83 | 3.86 | 3.99 | -3.4% |
91 | 0.009 | 0.010 | -12.2% |
92 | 0.62 | 0.76 | -18.82 |
101 | 0.09 | 0.09 | 2.0% |
102 | 0.91 | 0.90 | 0.6% |
103 | 3.18 | 3.18 | 0.0% |
Source: Buenaventura, 2021 (Buenaventura, 2021)
SRK Consulting (Peru) S. A. | May, 2022 |
SRK Consulting Peru SA SEC Technical Report Summary – El Brocal | Page 106 |
Table 11-12: Verification of the Global Bias in El Brocal Pb Domains
Domain | PB_OK | PB_NN | Difference |
|---|---|---|---|
11 | 0.077 | 0.079 | -3.6% |
21 | 0.01 | 0.01 | -1.8% |
22 | 0.20 | 0.20 | -2.0% |
31 | 0.01 | 0.01 | 3.9% |
32 | 0.32 | 0.30 | 3.4% |
33 | 2.52 | 2.42 | 3.9% |
41 | 0.01 | 0.01 | -9.0% |
42 | 0.31 | 0.31 | 0.9% |
43 | 1.70 | 1.71 | -0.6% |
51 | 0.01 | 0.01 | -0.19 |
52 | 0.42 | 0.39 | 5.3% |
53 | 1.58 | 1.50 | 4.6% |
61 | 0.02 | 0.02 | -2.3% |
62 | 0.14 | 0.14 | 3.1% |
71 | 0.01 | 0.01 | 9.8% |
72 | 0.15 | 0.16 | -2.4% |
81 | 0.01 | 0.01 | 2.8% |
82 | 0.08 | 0.08 | 4.5% |
91 | 0.01 | 0.01 | -2.6% |
101 | 0.01 | 0.01 | 3.4% |
102 | 0.10 | 0.10 | -2.5% |
Source: Buenaventura, 2021 (Buenaventura, 2021)
Table 11-13: Verification of the Global Bias in El Brocal Zn Domains
Dominio | ZN_OK | ZN_NN | Difference |
|---|---|---|---|
11 | 0.00 | 0.00 | 2.0% |
21 | 0.05 | 0.05 | 0.3% |
22 | 0.63 | 0.60 | 4.8% |
23 | 2.06 | 2.05 | 0.6% |
31 | 0.09 | 0.09 | 5.0% |
32 | 0.61 | 0.60 | 0.6% |
33 | 3.19 | 3.13 | 2.0% |
41 | 0.06 | 0.06 | 3.0% |
42 | 0.61 | 0.61 | 0.4% |
43 | 2.65 | 2.68 | -1.0% |
51 | 0.02 | 0.02 | -21.22 |
52 | 0.73 | 0.72 | 0.5% |
53 | 2.58 | 2.47 | 4.5% |
61 | 0.02 | 0.03 | -12.2% |
62 | 0.58 | 0.58 | 0.0% |
63 | 3.09 | 3.09 | -0.3% |
71 | 0.020 | 0.016 | 17.9% |
72 | 0.71 | 0.64 | 8.6% |
73 | 1.56 | 1.44 | 7.8% |
81 | 0.01 | 0.01 | 0.0% |
82 | 0.39 | 0.37 | 5.5% |
91 | 0.01 | 0.01 | -2.8% |
101 | 0.02 | 0.02 | 2.9% |
102 | 0.33 | 0.26 | 20.1% |
Source: Buenaventura, 2021 (Buenaventura, 2021)
Validation of the Local Estimation
SRK verified local biased by creating a series of swaths through El Brocal grade models by columns (with east direction), rows (with North direction) and levels (elevations), and by comparing the grade means of the composited and capped data, the interpolation grades by OK and NN.
SRK Consulting (Peru) S. A. | May, 2022 |
SRK Consulting Peru SA SEC Technical Report Summary – El Brocal | Page 107 |
In general, SRK considers that the Cu, Pb and Zn estimation model presents an appropriate consistency in the three axes that were compared. The swath plots revised in El Brocal are shown in Figure 11-13, Figure 11-14 and Figure 11-15.
SRK Consulting (Peru) S. A. | May, 2022 |
SRK Consulting Peru SA SEC Technical Report Summary – El Brocal | Page 108 |

Figure 11-13: Swath Plots Comparing Estimation of Cu OK Versus Cu NN in the Three Dimensions, in the Domain 62.
Source: SRK, 2021 (SRK, 2021)
SRK Consulting (Peru) S. A. | May, 2022 |
SRK Consulting Peru SA SEC Technical Report Summary – El Brocal | Page 109 |
Figure 11-14: Swath Plots Comparing Estimation of Pb OK Versus Pb NN in the Three Directions, in the Domain 32.
Source: SRK, 2021 (SRK, 2021)
SRK Consulting (Peru) S. A. | May, 2022 |
SRK Consulting Peru SA SEC Technical Report Summary – El Brocal | Page 110 |
Figure 11-15: Swath Plots Comparing Estimation of Zn OK Versus Zn NN in the Three Directions, in Domain 52.
Source: SRK, 2021 (SRK, 2021)
SRK Consulting (Peru) S. A. | May, 2022 |
SRK Consulting Peru SA SEC Technical Report Summary – El Brocal | Page 111 |
In most domains, the grade by Ordinary Kriging of most of the domains are located within 5 % of the bias with regard to the NN grade for all the elements analyzed. The percentage differences between the interpolation and the nearest neighbor methods are within the reasonable tolerances,
According to a visual examination and a comparison between the interpolation and nearest neighbor models, El Brocal resource model does not have global or local bias in most domains and represents a reasonable estimation of the in-situ resources without dilution.
Bulk Density |
Bulk density is obtained and measured from the diamond drillholes. A total of 13,317 density samples were taken in the deposit, which was divided into 3 zones according to their characteristics. The northern zone corresponds to “Tajo Norte” (TN) (open pit), the intermediate zone corresponds to "Tajo Sur” (TS) and the southern zone to Marcapunta Sur (MO).
Density measurements were conducted in the internal laboratory of El Brocal. Check samples were sent to an external and independent laboratory (Certimin in Lima) to control the mine density measurement quality. The bulk density is measured by paraffin wax method and the values are assigned in the block model considering the median obtained within each lithological unit; prior statistical evaluation where the density population medians are analyzed and all the values above 2 times the standard deviation are deleted to have a consistent database.
The density statistics is summarized in the table below (Table 11-14)
SRK Consulting (Peru) S. A. | May, 2022 |
SRK Consulting Peru SA SEC Technical Report Summary – El Brocal | Page 112 |
Table 11-14: El Brocal density measurement after statistical evaluation.
Descriptive Data | Statistics | |||||||||||
Deposit | Zone | Lithology | # Data | Minimum | Maximum | Range | Mean | Median | Standard Deviation | Variance | CV | Std Dv. |
MO | Mineral | Brecha | 442 | 2.28 | 4.20 | 1.92 | 3.22 | 3.21 | 0.433 | 0.187 | 0.134 | 0.0206 |
Mineral | Calera Inferior | 5 | 1.89 | 3.81 | 1.92 | 2.72 | 2.74 | 0.722 | 0.521 | 0.265 | 0.323 | |
Mineral | Calera Superior | 1 | 2.21 | 2.21 | 0 | 2.21 | 2.21 | - | - | - | - | |
Mineral | Conglomerado Shuco | 261 | 2.11 | 3.92 | 1.81 | 3.02 | 3.01 | 0.415 | 0.173 | 0.137 | 0.0257 | |
Mineral | Conglomerado Transicional | 58 | 1.93 | 3.70 | 1.77 | 2.66 | 2.68 | 0.476 | 0.227 | 0.179 | 0.0625 | |
Mineral | Dacita Porfirítica | 553 | 1.67 | 3.42 | 1.75 | 2.49 | 2.42 | 0.365 | 0.134 | 0.147 | 0.0155 | |
Mineral | Mitu | 179 | 2.00 | 3.50 | 1.50 | 2.69 | 2.67 | 0.328 | 0.108 | 0.122 | 0.0245 | |
TS | Mineral | Brecha | 67 | 2.51 | 4.14 | 1.63 | 3.34 | 3.34 | 0.403 | 0.163 | 0.121 | 0.0492 |
Mineral | Calera Inf | 407 | 1.84 | 4.13 | 2.29 | 2.90 | 2.87 | 0.476 | 0.226 | 0.164 | 0.0236 | |
Mineral | Calera Mid(fav) | 666 | 1.889 | 3.89 | 2.00 | 2.82 | 2.74 | 0.425 | 0.180 | 0.151 | 0.0165 | |
Mineral | Calera Mid(var) | 43 | 1.93 | 3.88 | 1.95 | 2.76 | 2.57 | 0.481 | 0.231 | 0.174 | 0.0733 | |
Mineral | Calera Sup | 16 | 2.42 | 4.52 | 2.10 | 3.54 | 3.67 | 0.635 | 0.404 | 0.179 | 0.159 | |
Mineral | Conglomerado Shuco | 4,059 | 2.33 | 4.34 | 2.00 | 3.29 | 3.262 | 0.440 | 0.194 | 0.134 | 0.00691 | |
Mineral | Conglomerado Transicional | 1,850 | 2.15 | 4.08 | 1.936 | 3.08 | 3.05 | 0.408 | 0.166 | 0.132 | 0.00948 | |
Mineral | Dacita Porfirítica | 750 | 2.09 | 3.46 | 1.37 | 2.72 | 2.68 | 0.227 | 0.0514 | 0.0835 | 0.00828 | |
Mineral | Deposito Piroclástico | 2 | 2.65 | 3.25 | 0.60 | 2.95 | 2.95 | 0.421 | 0.178 | 0.143 | 0.298 | |
Mineral | Mitu | 381 | 2.26 | 3.85 | 1.60 | 2.91 | 2.82 | 0.301 | 0.0908 | 0.104 | 0.0154 | |
TN | Mineral | Calera Inferior | 47 | 1.98 | 3.51 | 1.53 | 2.65 | 2.57 | 0.389 | 0.152 | 0.147 | 0.0568 |
Mineral | Calera Mid(fav) | 526 | 1.83 | 3.50 | 1.67 | 2.64 | 2.57 | 0.393 | 0.154 | 0.149 | 0.0171 | |
Mineral | Calera Mid(var) | 67 | 1.83 | 3.33 | 1.50 | 2.53 | 2.47 | 0.334 | 0.111 | 0.132 | 0.0408 | |
Mineral | Calera Superior | 107 | 1.79 | 3.68 | 1.89 | 2.74 | 2.63 | 0.476 | 0.226 | 0.174 | 0.0460 | |
Mineral | Conglomerado Shuco | 2 | 2.62 | 2.67 | 0.05 | 2.64 | 2.64 | 0.0361 | 0.00130 | 0.0136 | 0.0255 | |
Mineral | Conglomerado Transicional | 8 | 2.07 | 2.63 | 0.56 | 2.44 | 2.50 | 0.196 | 0.0384 | 0.0803 | 0.0692 | |
Mineral | Mitu | 6 | 2.46 | 2.64 | 0.18 | 2.53 | 2.53 | 0.0639 | 0.00409 | 0.0252 | 0.0261 | |
Source: SRK, 2021 (SRK, 2021)
SRK Consulting (Peru) S. A. | May, 2022 |
SRK Consulting Peru SA SEC Technical Report Summary – El Brocal | Page 113 |
Mineral Resources Classification |
To conduct the resource classification, SRK considered a strategy based on multiple criteria:
| ● | Representativeness of the data used in the estimation (samples and drillholes) |
| ● | Methodology of confidence limit |
| ● | Estimation quality (Slope of Regression – SoR) |
| ● | Structural Model Confidence |
| ● | QAQC Performance |
Data used in the estimation
Buenaventura use a variable in their classification script to consider the samples and drillholes that are part of the classification criteria. The variable was calculated as the average anisotropic distance of the nearest three drillholes. Based on this variable and on a number of holes participating in the block estimation, the classification was made according to follow: measured when there is 3 or more drillholes, indicated when there is 2 or more drillholes and inferred when there is 1 or more drillholes.
Confident Limit
The confidence limit method was used by Buenaventura as other criteria to classify the resources. This analysis was applied for two zones: Zinc zone corresponding to the northern part of deposit (open pit: “Tajo Norte”) and Cooper Zone corresponding to middle and south part (open pit and underground), “Tajo Sur” and “Marcapunta”, respectively. The Figure 11-16 shows this limit.

Figure 11-16: Influence limit to classify the El Brocal resources
Source: Buenaventura, 2021 (Buenaventura, 2021)
The parameters to be evaluated according to the production volume of a month were determined as follow. (Table 11-15)
SRK Consulting (Peru) S. A. | May, 2022 |
SRK Consulting Peru SA SEC Technical Report Summary – El Brocal | Page 114 |
Table 11-15: Summary of aspect to be evaluated in confident limit analysis
Zinc zone | Copper Zone | ||
Mining method | Open Pit | Mining Method | Sub Level Stoping |
Tonnes per day (t) | 6,333 | Tonnes per day (t) | 5,000 |
Tonnes per month (t)) | 190,000 | Tonnes per month (t) | 150,000 |
Tonnes per quarter (t) | 570,000 | Tonnes per quarter (t) | 450,000 |
Volume per quarter (SG:2.58) | 220,930 | Volume per quarter (SG:3) | 150,000 |
Volume 50x50x10m block | 216,000 | Volume 50x50x10m block | 160,000 |
Source: Buenaventura, 2021 (Buenaventura, 2021)
Different scenarios of drilling mesh each 10 meters were defined. Supported on the EDA and the variogram, the Kriging variance (KV) and the composite variation coefficient (CV) were determined, too. Then, the relative standard error and the confident limit to 90% are calculated for an annual production volume (A90%), and the confident limit to 90% for a quarterly production volume (Q90%). The results are summarized in Table 11-16 and Table 11-17.
Table 11-16: Calculation of A90% and Q90% based for each drilling mesh for Zinc zone
Spacing | CV Comp | OKV | RSE | A90% | Q90% | Slope | BDV | KV/BDV |
|---|---|---|---|---|---|---|---|---|
100x100 | 1.150 | 0.0950 | 0.35 | 17% | 34% | 0.9512 | 0.1902 | 0.50 |
80x80 | 1.150 | 0.0837 | 0.33 | 16% | 32% | 0.9385 | 0.1902 | 0.44 |
60x60 | 1.150 | 0.0651 | 0.29 | 14% | 28% | 0.9754 | 0.1902 | 0.34 |
50x50 | 1.150 | 0.0497 | 0.26 | 13% | 25% | 0.9934 | 0.1902 | 0.26 |
40x40 | 1.150 | 0.0331 | 0.21 | 10% | 20% | 0.9962 | 0.1902 | 0.17 |
30x30 | 1.150 | 0.0165 | 0.15 | 8% | 15% | 1.0036 | 0.1902 | 0.09 |
20x20 | 1.150 | 0.0091 | 0.11 | 6% | 11% | 1.0009 | 0.1902 | 0.05 |
10x10 | 1.150 | 0.0023 | 0.06 | 3% | 6% | 1.0011 | 0.1902 | 0.01 |
Source: Buenaventura, 2021
Table 11-17: Calculation of A90% and Q90% based for each drilling mesh for Zinc zone
Spacing | CV Comp | OKV | RSE | A90% | Q90% | Slope | BDV | KV/BDV |
100x100 | 1.190 | 1.190 | 0.0453 | 0.25 | 13% | 25% | 0.6085 | 0.0489 |
80x80 | 1.190 | 1.190 | 0.0482 | 0.26 | 13% | 25% | 0.5143 | 0.0489 |
60x60 | 1.190 | 1.190 | 0.0423 | 0.24 | 12% | 24% | 0.6130 | 0.0489 |
50x50 | 1.190 | 1.190 | 0.0374 | 0.23 | 11% | 22% | 0.6750 | 0.0489 |
40x40 | 1.190 | 1.190 | 0.0323 | 0.21 | 11% | 21% | 0.7745 | 0.0489 |
30x30 | 1.190 | 1.190 | 0.0209 | 0.17 | 9% | 17% | 0.8855 | 0.0489 |
20x20 | 1.190 | 1.190 | 0.0130 | 0.14 | 7% | 13% | 0.9344 | 0.0489 |
10x10 | 1.190 | 1.190 | 0.0045 | 0.08 | 4% | 8% | 0.9957 | 0.0489 |
Source: Buenaventura, 2021
Note:
KV = Kriging Variance for the estimation of a monthly volume
RSE = Relative Standard Error = CVComps x √KV
Q90% = Confidence Limit at 90% for a Quarterly Volume = (1.645 x RSE) / √3
A90% = Confidence Limit at 90% for an Annual Volume = (1.645 x RSE) / √12
BDV = Block Dispersion Variance
SRK Consulting (Peru) S. A. | May, 2022 |
SRK Consulting Peru SA SEC Technical Report Summary – El Brocal | Page 115 |
Finally, the spacing with error less or equal to 15% in Q90% is considered as Measured Resource. The spacing with error less or equal to 15% in A90% is considered as Indicated Resources. These values are calculated from the plots show in Figure 11-17 and Figure 11-18, for Zinc zone and Copper zone, respectively.
Figure 11-17: Plot of space vs error for Zn zone
Source: Buenaventura, 2021

Figure 11-18: Plot of space vs error for Cu zone
Source: Buenaventura, 2021
After Confident Limit analysis, Buenaventura determined a spacing average of 25 m for measured and 50 m for indicated in Zinc zone; and the spacing average in copper zone is 15 m for measured and 25 m for indicated resources.
QAQC Performance
SRK carried out the evaluation to determine the risk due to the poor QAQC results in some areas of El Brocal deposit considering some parameters such as the insertion of QAQC control samples in drilling program, analysis of the QAQC results (contamination, precision, and accuracy) and the results of the mitigation work carried out by Buenaventura in 2021 to compensate the bad or absence of QAQC (i.e resampling, twin drilling, etc). Then, a risk level was assigned to each drillhole or zone within the deposit. High risk with code 1 for poor QAQC or no QAQC results, medium risk with code 2, QAQC and mitigation work with reasonable results, and low risk with code
SRK Consulting (Peru) S. A. | May, 2022 |
SRK Consulting Peru SA SEC Technical Report Summary – El Brocal | Page 116 |
3, with acceptable and good QAQC results. Figure 11-19 shows the limits assignments in Brocal after evaluation.

Figure 11-19: Limits about the QAQC risk based in performance of results
Source: SRK, 2021 (SRK, 2021)
Structural Model
The albescence of a structural model at the feasibility level means that the structural component is considered a risk in resource classification, especially in the southern part.
SRK carried out the evaluation to determine the risk associated with structural geology, which is an important control of mineralization in the deposit. Some criteria were considered to evaluate the level of risk such as: adequate reports, density, quality and confidence of structural data, confidence and characteristics in the modeled faults and the quality of the structural model. From this analysis, the risk associated with low, medium and high levels was determined, dividing the deposit into 3 zones. The northern part where the open pit is located presents a low risk, the middle part presents a medium risk level and the southern part presents a high-risk level, principally due to the low structural information that is available and the conceptual structural model that it presents. (Figure 11-20)
SRK Consulting (Peru) S. A. | May, 2022 |
SRK Consulting Peru SA SEC Technical Report Summary – El Brocal | Page 117 |

Figure 11-20: Limits about the structural model risk based in confidence information and results
Source: SRK, 2021
Estimation Quality (SoR)
SKR suggested including a variable as the estimation accuracy in resources classification criteria. Buenaventura used the slope of regression as an additional criteria based on the knowledge and experience of other mines that use the same method. These mines used the following ranges to classify the resources: major to 0.8 for measured, between 0.4 and 0.8 for indicated, and inferred is 0.2 and 0.4.
The suggested ranges (SoR) used in the classification have been tested and validated by a polymetallic mine in the last 10 years. Therefore, they have been calibrated based on operating and drilling data following CIM best practices year to year. In addition, these deposits have been listed on the Toronto Stock Exchange the last 15 years.
Based on the parameters mentioned above and the uncertainty associated to the classification, the valorization that will be used in the model classification are summarized in the following tables (Table 11-18 and Table 11-19).
Table 11-18: Risk Associated to the Information and Estimation Results
Risk | Code | Observations |
|---|---|---|
High | 1 | Associated to poor information and results |
Medium | 2 | Associated to reasonable information and results |
SRK Consulting (Peru) S. A. | May, 2022 |
SRK Consulting Peru SA SEC Technical Report Summary – El Brocal | Page 118 |
Risk | Code | Observations |
Low | 3 | Associated to good information and results |
Source: SRK, 2021 (SRK, 2021)
Table 11-19: Summary of Values that will be Used in the Classification
Test result | Risk | |||
Good | Reasonable | Poor | ||
3 | 2 | 1 | ||
Slope of Regresión (SoR) | <0.8 | 0.8 - 0.5 | > 0.5 - 0.2 | |
Confident Limit (range) | Zn zone | 25 | 50 | 150 |
Cu zone | 15 | 25 | 100 | |
Drill holes | >=3 | >=2 | >=1 | |
QAQC | 3 | 2 | 1 | |
Structural Model | 3 | 2 | 1 | |
Source: SRK, 2021 (SRK, 2021)
Finally, the resource classification will be performed block by block of the model through a script in Vulcan software, considering the addition of the score associated to the risk according to the following criteria:
| ● | Measured >= 13 |
| ● | Indicated >= 9 y < 13 |
| ● | Inferred < 9 |
To prevent the artifacts and the “spotted dog” effect, Buenaventura conducted a manual contouring to smooth the final model of the classification (Figure 11-21).
SRK Consulting (Peru) S. A. | May, 2022 |
SRK Consulting Peru SA SEC Technical Report Summary – El Brocal | Page 119 |

Figure 11-21: Resources Classification process
(above: scripted, below: smoothed, right: section location)
Source: Buenaventura, 2021 (Buenaventura, 2021)
Reconciliation |
SRK reviewed the results of the reconciliation carried out by Buenaventura and compared the estimated tons and grades of the resource model with the monthly production of the 2020 and 2021 periods. It should be noted that 2020 was an atypical year due to the SARS-COVID 19 pandemic, that's the reason why in some months there was no production report.
Buenaventura performs the reconciliation process using the results of the ore extracted from the mine (underground) and the metallurgical report of the monthly processing plant. The production results are obtained from the long-term resource model (tonnage and grade), include an exploitation wireframe delivered by planning area (and topography) month by month, then the balance of the stockpiles is carried out at the beginning and end before being transported to the plant. Finally, the results of the monthly metallurgical report provided by the processing plant are delivered.
It is worth mentioning that the tonnage of the trucks or bins does not consider in this calculation, nor the material extracted from the open pit, because they include other variables that are still in the implementation process by Buenaventura.
SRK Consulting (Peru) S. A. | May, 2022 |
SRK Consulting Peru SA SEC Technical Report Summary – El Brocal | Page 120 |
SRK used this comparison for the review of the long-term resource model performance, in conjunction with the estimation validations (cross, visual, global and local) and classification in order to provide opportunities for improvement in the estimation parameters and reduce biases in each updating in the resources model.
In opinion of SRK, El Brocal is performing reasonably in the current Mineral Resources estimate compared to the reconciled production periods (Table 11-20). However, for SRK there is still an opportunity for improvement in the grade interpolation because there are some months where copper and silver are underestimated, and gold overestimated. It must also implement a more robust reconciliation process that includes material from the open pit.
Table 11-20: Reconciliation for 2020 and 2021 Periods
Month | Block model depletion and production (underground) | Proccesing Plant | Statitiscal Comparison | |||||||||
Tonnes | Cu | Ag | Au | Tonnes | Cu | Ag | Au | Tonnes | Cu | Ag | Au | |
t | % | Oz/t | g/t | t | % | Oz/t | g/t | t | % | Oz/t | g/ | |
Jan-2020 | 202,568 | 2.06 | 0.71 | 0.73 | 201,900 | 1.77 | 0.76 | 0.61 | 1.00 | 0.86 | 1.06 | 0.84 |
Feb-2020 | 164,344 | 2.56 | 0.63 | 0.57 | 175,165 | 1.92 | 0.62 | 0.59 | 1.07 | 0.75 | 0.98 | 1.04 |
Mar-2020 | 182,336 | 2.47 | 0.66 | 0.59 | 130,094 | 2.18 | 0.74 | 0.52 | 0.71 | 0.88 | 1.12 | 0.87 |
Jun-2020 | 162,751 | 2.02 | 0.66 | 0.57 | 154,849 | 2.11 | 0.72 | 0.53 | 0.95 | 1.05 | 1.09 | 0.92 |
Jul-2020 | 166,486 | 2.04 | 0.52 | 0.49 | 171,624 | 1.89 | 0.65 | 0.41 | 1.03 | 0.93 | 1.24 | 0.84 |
Aug-2020 | 192,681 | 2.12 | 0.56 | 0.52 | 164,619 | 1.91 | 0.60 | 0.55 | 0.85 | 0.90 | 1.07 | 1.05 |
Sep-2020 | 199,078 | 2.14 | 0.88 | 0.53 | 189,176 | 1.91 | 0.83 | 0.51 | 0.95 | 0.89 | 0.95 | 0.96 |
Oct-2020 | 215,287 | 2.72 | 0.97 | 0.63 | 200,187 | 2.09 | 0.85 | 0.58 | 0.93 | 0.77 | 0.88 | 0.91 |
Nov-2020 | 198,248 | 2.37 | 1.15 | 0.71 | 150,674 | 2.04 | 0.90 | 0.66 | 0.76 | 0.86 | 0.78 | 0.94 |
Dec-2020 | 91,870 | 1.80 | 0.67 | 0.56 | 121,442 | 1.99 | 1.22 | 0.55 | 1.32 | 1.11 | 1.82 | 0.99 |
Jan-2021 | 100,586 | 1.51 | 0.59 | 0.50 | 123,752 | 1.88 | 0.75 | 0.47 | 1.23 | 1.24 | 1.27 | 0.96 |
Feb-2021 | 154,357 | 2.17 | 0.82 | 0.73 | 174,102 | 1.76 | 0.73 | 0.64 | 1.13 | 0.81 | 0.89 | 0.88 |
Mar-2021 | 205,614 | 1.77 | 0.87 | 0.95 | 199,914 | 1.57 | 0.79 | 0.72 | 0.97 | 0.88 | 0.90 | 0.75 |
Apr-2021 | 198,761 | 1.73 | 0.80 | 1.05 | 206,908 | 1.58 | 1.03 | 0.76 | 1.04 | 0.91 | 1.30 | 0.72 |
May-2021 | 231,630 | 1.54 | 0.54 | 0.97 | 232,233 | 1.75 | 0.94 | 0.77 | 1.00 | 1.13 | 1.75 | 0.80 |
Jun-2021 | 190,110 | 1.55 | 0.68 | 0.88 | 205,314 | 1.72 | 0.93 | 0.78 | 1.08 | 1.12 | 1.37 | 0.89 |
Jul-2021 | 132,125 | 1.39 | 0.79 | 1.15 | 200,607 | 1.68 | 1.29 | 1.01 | 1.52 | 1.21 | 1.64 | 0.88 |
Aug-2021 | 205,866 | 1.60 | 0.67 | 1.11 | 138,987 | 1.82 | 1.35 | 0.93 | 0.68 | 1.14 | 2.01 | 0.84 |
Sep-2021 | 205,028 | 1.85 | 0.71 | 1.12 | 199,516 | 1.79 | 0.89 | 1.00 | 0.97 | 0.96 | 1.25 | 0.90 |
Oct-2021 | 233,295 | 1.27 | 0.71 | 0.94 | 259,817 | 1.68 | 0.97 | 0.89 | 1.11 | 1.32 | 1.37 | 0.95 |
Source: Buenaventura, 2021 (Buenaventura, 2021)
Cut-off grade estimates |
Due presence of copper, zinc and lead as valuable metal contents, the cut/off grade is expressed in terms of unit value or USD/t.
Cost Calculation
Cost calculation is based on unit values used for the mineral reserve’s definition. A Marginal cost is calculated to be used a cut-off value to set the minimum value of economically mineable stopes
SRK Consulting (Peru) S. A. | May, 2022 |
SRK Consulting Peru SA SEC Technical Report Summary – El Brocal | Page 121 |
and pit, for Mineral Resources definition purposes. In case of open pit the cost calculation is considered for both lead and zinc ore zones, as well as the copper zone, which have different destinations in the metallurgical plant.
The cut-off value used to report Mineral Resources is based on the average operating costs for the operation in the year 2021, determined by the finance and operations departments of Sociedad Minera El Brocal. The Cut Off was differentiated according to the material treated in the plant (Pb-Zn, Cu and Bulk) that have been taken into account when determining the cut-off value of Mineral Resources during 2021 for the Open Pit projects as shown in Table 11-21.
The zones determined by the planning area to be treated in the Pb-Zn plant have a mine cost of US$ 26.69/t. Taking into account a contingency of 10% on operating costs, a final NSR cut-off value of US$ 27.15/t is defined.
The zones determined by the planning area to be treated in the Cu plant have a mine cost of US$ 25.51/t. Taking into account a contingency of 10% on operating costs, a final NSR cut-off value of US$/t 25.97 is defined.
The zones determined by the planning area to be treated in the “Bulk” plant have a mine cost of US$22.25/t. Taking into account a contingency of 10% on operating costs, a final NSR cut-off value of US$ 22.71/t is defined.
Table 11-21: Cost structure for El Brocal resources (open pit)
Cost (US$/t) | |||
Pb-Zn | Cu | Bulk | |
1. Mine | 1.70 | 1.70 | 1.70 |
2. Pb-Zn Plant | 15.88 | 14.80 | 11.84 |
3. Services | 6.22 | 6.22 | 6.22 |
Sub-Total OPEX | 23.80 | 22.72 | 19.76 |
4. Inventory and Exploration Expenses | -0.66 | -0.66 | -0.66 |
Sub total | 23.14 | 22.06 | 19.10 |
5. Administrative Expenses | 1.51 | 1.51 | 1.51 |
6. Off Site Expenses | 0.22 | 0.22 | 0.22 |
7. Sustaining CAPEX | 1.25 | 1.25 | 1.25 |
9. Contingency (10%) (Fixed + Variable) | 2.44 | 2.37 | 2.04 |
Sub Total | 28.56 | 27.84 | 24.12 |
9. Contingency (10%) Internal (Fixed + Variable) | 2.27 | 2.16 | 1.87 |
Sub Total - Contingency | 26.69 | 25.51 | 22.25 |
Delta Mineral Stripping Cost | 0.42 | 0.42 | 0.42 |
9. Contingency (10%) (Mineral Stripping Cost) | 0.04 | 0.04 | 0.04 |
Total Cut Off* | 27.15 | 25.97 | 22.71 |
*Total Cut Off is the sum of Sub Total - Contingency + Delta Mineral Stripping Cost + Contingency (10% Mineral Stripping Cost) | |||
Source: Buenaventura, 2022 (Buenaventura, 2021)
In underground operation, Buenaventura considers five extraction methods: Pit Production R&P, Pillar Reclamation with debris fill (Secondary), Remaining Mined Areas, Pillar Reclamation with cemented fill (Secondary) and 12x13 Chambers and Pillars with 5% cemented fill (Primary and Secondary) that have been taken into account when determining the cut-off value of Mineral Resources during 2021 for the Underground projects, as shown in Table 11-22.
SRK Consulting (Peru) S. A. | May, 2022 |
SRK Consulting Peru SA SEC Technical Report Summary – El Brocal | Page 122 |
The zones determined by the planning area to be extracted by Pit Production R&P mining method have a mine cost of US$ 33.75/t. Taking into account a contingency of 10% on operating costs, a final NSR cut-off value of US$ 37.48/t is defined.
The zones determined by the planning area to be extracted by the Pilar Recovery mining method with debris fill (Secondary) have an estimated mine cost of US$ 27.79/t. Taking into account a contingency of 10% on operating costs, a final NSR cut-off value of US$ 30.92/t is defined.
The zones determined by the planning area to be extracted by the Remaining Mined Areas mining method have an estimated mine cost of US$ 34.91/t. Taking into account a contingency of 10% on operating costs, a final NSR cut-off value of US$ 38.76/t is defined.
The zones determined by the planning area to be extracted by the Pilar Recovery mining method with cemented fill (Secondary) have an estimated mine cost of US$ 35.08/t. Taking into account a contingency of 10% on operating costs, a final NSR cut-off value of US$ 38.94/t is defined.
The zones determined by the planning area to be extracted by the 12x13 Chambers and pillars mining method with 5% cemented fill (Primary and Secondary) have an estimated mine cost of US$ 37.05/t. Taking into account a contingency of 10% on operating costs, a final NSR cut-off value of US$ 41.11/t is defined.
Table 11-22: Cost structure for El Brocal resources (underground)
Cost (US$/t) | |||||
|---|---|---|---|---|---|
Stope Production R&P | Recovery of Pilar with detrital filling (Secondary) | Remaining Mined Areas | Pillar recovery with cemented filling (Secondary) | Chambers and pillars 12x13 with 5% cemented filling (Primary and Secondary) | |
1. Mine | 18.95 | 12.98 | 20.11 | 20.27 | 22.25 |
2. Plant | 14.80 | 14.80 | 14.80 | 14.80 | 14.80 |
3. Services | 0.00 | 0.00 | 0.00 | 0.00 | 0.00 |
Sub total | 33.75 | 27.79 | 34.91 | 35.08 | 37.05 |
4. Inventory and Exploration Expenses | 0.00 | 0.00 | 0.00 | 0.00 | 0.00 |
Sub total Opex | 33.75 | 27.79 | 34.91 | 35.08 | 37.05 |
5. Off Site Expenses | 0.36 | 0.36 | 0.36 | 0.36 | 0.36 |
6. Contingency (10%)* | 3.37 | 2.78 | 3.49 | 3.51 | 3.71 |
Total Cut Off** | 37.48 | 30.92 | 38.76 | 38.94 | 41.11 |
*Contingency = (Sub Total OPEX)*0.1 | |||||
**Total Cut Off is the sum of SubTotal OPEX + Contingency + Off Site Expenses | |||||
Source: Buenaventura, 2021 (Buenaventura, 2021)
Reasonable Potential for Economic Extraction (RPEE) |
As part of the Mineral Resources estimation process, an evaluation was developed to determine the reasonability of material estimated into the block model of El Brocal for economic extraction. It to comply with resource disclosure requirements.
| ● | Mining method definition |
| ● | Cost definition set for mineral reserves definition |
| ● | Metallurgical parameters (non verified by SRK) |
| ● | NSR calculated and included as part of block model file (non replicated by SRK) |
| ● | Mineable stope and pit definition |
SRK Consulting (Peru) S. A. | May, 2022 |
SRK Consulting Peru SA SEC Technical Report Summary – El Brocal | Page 123 |
| ● | Underground (UG) and open pit (OP) cut-off and continuity |
The RPEE process is similar to the mineral reserve definition process. Details of the mineral reserve’s estimation process are contained in Chapters 12 and 13 of this report. Table 11-23 shows a summary of the criteria and parameters used in this process.
Table 11-23: Parameters used for RPEE evaluation.
Parameter | Description | Source |
|---|---|---|
Block Model Resources | Vulcan Files | Buenaventura |
Metal Prices | 8,000 USD / t Cu | Buenaventura |
NSR Calculation | OP: (GradeZn(%)*11.12*Recovery UG: (GradeCu(%)*48.58*Recovery | Buenaventura |
Cut-off grade | OP: Zn: 27.14 USD / t ; Cu: 25.95 USD / t UG: North and Center: 38.94 USD / t; | Buenaventura |
Source: Buenaventura, 2021 (Buenaventura, 2021)
Metallurgical Recoveries
To define metallurgical parameters, Buenaventura have carried out studies to obtain metallurgical recoveries functions for mining zone. Note that El Brocal has two metallurgical plants that treat different minerals. SRK cannot verify or replicate the assignment of metallurgical recoveries into the block model.
The next tables summarize the criteria and formulas used to obtain metallurgical recoveries in El Brocal (Table 11-24).
Table 11-24: Metallurgical recoveries functions for El Brocal
Metal | Applicable Grade Range | Metallurgical Recovery function 1 |
Cu | Cu Grade (%) <= 0.20 | 0.00 |
0.20 < Cu Grade (%) <= 0.70 | [ Cu Grade (%) - 0.20 ] / Cu Grade (%) | |
0.70 < Cu Grade (%) <= 1.935 | LN [ Cu Grade (%) ] * 0.205 + 0.794 | |
1.935 < Cu Grade (%) <= 2.50 | 0.05074 * Cu Grade (%) + 0.82932 | |
2.50 < Cu Grade (%) | 0.96 |
SRK Consulting (Peru) S. A. | May, 2022 |
SRK Consulting Peru SA SEC Technical Report Summary – El Brocal | Page 124 |
Ag | Ag Grade (oz/t) <= 0.12 | 0.00 | |
0.12 < Ag Grade (oz/t) <= 0.29 | [ Ag Grade (oz/t) - 0.12 ] / Ag Grade (oz/t) | ||
0.29 < Ag Grade (oz/t) <= 2.00 | 0.0665 * Ag Grade (oz/t) + 0.56669 | ||
2.00 < Ag Grade (oz/t) | 0.70 | ||
Au | Au Grade (g/t) <= 0.12 | 0.00 | |
0.12 < Au Grade (g/t) <= 0.20 | [ Au Grade (g/t) - 0.12 ] /Au Grade (g/t) | ||
0.20 < Au Grade (g/t) <= 1.00 | 0.047582 * Au Grade (g/t) + 0.40008 | ||
1.00 < Au Grade (g/t) <= 1.50 | 0.344 * Au Grade (g/t) + 0.1040 | ||
1.50 < Au Grade (g/t) | 0.62 | ||
Pb 2 3 | 0.00 < [ (Pb Grade (%) - PbOx (%) ] <= 0.40 | [ Pb Grade (%) - PbOx (%) ] * 0.80 / Pb Grade (%) | |
0.40 < [ (Pb Grade (%) - PbOx (%) ] <= 0.80 | [ Pb Grade (%) - PbOx (%) ] * 0.85 / Pb Grade (%) | ||
0.80 < [ (Pb Grade (%) - PbOx (%) ] | [ Pb Grade (%) - PbOx (%) ] * 0.90 / Pb Grade (%) | ||
Ag | 0.00 < Ag Grade (oz/t) <= 0.12 | 0.00 | |
0.12 < Ag Grade (oz/t) <= 0.29 | [ Ag Grade (oz/t) - 0.12 ] / Ag Grade (oz/t) | ||
0.29 < Ag Grade (oz/t) <= 2.00 | 0.0665 * Ag Grade (oz/t) + 0.56669 | ||
2.00 < Ag Grade (oz/t) | 0.70 | ||
Zn 4 5 | Fe>9.6% | 0.00 < [ (Zn Grade (%) - ZnOx (%) ] <= 0.40 | [ [ Zn Grade (%) - ZnOx (%) ] - [ Fe Grade (%) - 9.6 ] |
0.40 < [ (Zn Grade (%) - ZnOx (%) ] <= 0.80 | [ [ Zn Grade (%) - ZnOx (%) ] - [ Fe Grade (%) - 9.60 ] | ||
0.80 < [ (Zn Grade (%) - ZnOx (%) ] <= 2.50 | [ [ Zn Grade (%) - ZnOx (%) ] - [ Fe Grade (%) - 9.60 ] | ||
Fe<=9.6% | 0.00 < [ (Zn Grade (%) - ZnOx (%) ] <= 0.40 | [ Zn Grade (%) - ZnOx (%) ] * 0.60 / Zn Grade (%) | |
0.40 < [ (Zn Grade (%) - ZnOx (%) ] <= 0.80 | [ Zn Grade (%) - ZnOx (%) ] * 0.65 / Zn Grade (%) | ||
0.80 < [ (Zn Grade (%) - ZnOx (%) ] <= 2.50 | [ Zn Grade (%) - ZnOx (%) ] * 0.68 / Zn Grade (%) | ||
All | 2.50 < [ (Zn Grade (%) - ZnOx (%) ] | 0.68 | |
Ag | 0.00 < Ag Grade (oz/t) <= 0.35 | 0.00 | |
0.35 < Ag Grade (oz/t) | 0.249 | ||
Source: SRK, 2021
1 Grades expressed as a percentage must be considered in the same units in the recovery functions
2 Pb Grade refers to the total content of Lead. PbOx referes to the Lead Oxide content (expressed as a percentage)
3 Pb recovery functions are applicable only if [ Pb Grade > 0 ] AND [ Pb Grade - PbOx > 0 ]. Otherwise metallurgical recovery must be cosidered as zero
4 Zn Grade refers to the total content of Zinc. ZnOx refers to the Zinc Oxide content (expressed as a percentage)
SRK Consulting (Peru) S. A. | May, 2022 |
SRK Consulting Peru SA SEC Technical Report Summary – El Brocal | Page 125 |
5 Zn recovery functions are applicable only if [ Zn Grade > 0 ] AND [ Zn Grade - ZnOx > 0 ]. Otherwise metallurgical recovery must be cosidered as zero
Based on mineral reserves process references, currently the deposit is mined using open pit and underground methods, the select mining method is sublevel stopping for underground.
Mineral Resources at northern zone (OP) are reported within a pit shell generated in whittle software. Pit optimization input are noted as follows:
| ● | Cut-off grade of 27.14 USD / t for Zinc ore and 25.95 USD / t for Cu ore. |
| ● | Revenue factor of 1.00 |
| ● | Pit Slope of 23.9 ° |
| ● | Copper price of 8,000 USD / t; Zinc price of 2,385 USD / t; Lead price of 2,286 USD / t; Gold price of 1,600 USD / Oz and Silver price of 25 USD / Oz |
| ● | Cost is referential for processing of 20 k tpd |
| ● | Other costs can see in cost structures in Table 11-21 |
The input parameters were based on:
| ● | Metal prices net selling cost including concentrate refining. |
| ● | Bench-marked mining, processing and general and administrative (G&A) costs based on estimates and current costs for similar sized and similar types of operations in the region. |
| ● | Metallurgical recoveries are based on testing benchmarks. |
| ● | The pit shell was determined by evaluation of an NSR (see Table 11-23) |
| ● | The pit shell was restricted to copper–zinc mineralization that occurs on northern zone of El Brocal. |
To prove reasonable perspectives for an economic extraction for El Brocal underground, Buenaventura constructed restrictive conceptual stopes for the mineralized structures using Deswik Stope Optimizer ™, based on measured, indicated and inferred mineralized material, considering the structure width and the net smelter return (NSR), limited to a differentiated Cut Off to limit the stopes generated.
| ● | Stope height: 15 to 35 m |
| ● | Stope length: 20 to 100 m |
| ● | Minimum width: 12 to 14 m |
| ● | Optimization variable: NSR |
| ● | Cut-Off: Marginal (see Table 11-25) |
| ● | Pillar length: 6 to 8 m |
| ● | Measured, Indicated and Inferred Resources in the same process are considered within the optimization. |
Table 11-25: Cut-Off differentiated by Mining Method
Zone | Cutoff (US$/t) |
Marcapunta Este | 37.5 & 41.1 |
Marcapunta Oeste | 34.7 |
Marcapunta Oeste 2 | 38.4 |
Marcapunta Sur | 38.4 |
SRK Consulting (Peru) S. A. | May, 2022 |
SRK Consulting Peru SA SEC Technical Report Summary – El Brocal | Page 126 |
Source: Buenaventura, 2021 (Buenaventura, 2021)
The pillars left in the ground do not correspond to square pillars (as it happens in the classical application of the method) but to a pillar along the entire mining direction and that covers the extension of the mantle, these pillars are called "running pillar" as show the Figure 11-22.

Figure 11-22: Schematic graph of Room and Pillar with long holes and Sub Level Stopping.
Source: Buenaventura, 2021 (Buenaventura, 2021)
Uncertainty in the Mineral Resources Estimation |
SRK has revised some aspects that can be considered as uncertainties in El Brocal Mine Mineral Resources estimation, which are:
| ● | The density assigned in the block model has enough support for most of the estimation domains, however, there are some domains that have low data density. Buenaventura must conduct an additional sampling program in the next drilling program. |
| ● | El Brocal must improve the geological interpretation to increase the confidence on the geological models, which must be supported with the geological mapping of alterations, mineralization and lithology. El Brocal structural model is a key and important point towards the southern part in the underground zone. |
| ● | The estimation domains for all the elements must be revised in detail to improve their definition. There are zones where the model can be improved, especially in those zones in which the grade interpolation is underestimated locally. |
| ● | The resource classification that reflects resource estimation confidence is a key and sensitive aspect in El Brocal Mine, since although it is a mine with production from 2011 and an extensive drilling program, it does not have enough measured resources due to several factors such as the lack of a powerful structural model in the southern zone and the low QA/QC performance in some areas of El Brocal. |
Summary Mineral Resources |
Buenaventura has reported the Mineral Resources for El Brocal on the December 2021 in accordance with U.S Securities and Exchange Commission (SEC) Sk-1300.
Mineral Resources are considered potentially mineable by open pit and underground methods. Buenaventura has stated the Mineral Resources in El Brocal with a different cut-off grade for each type of mineral and mining method (open pit or underground).
SRK Consulting (Peru) S. A. | May, 2022 |
SRK Consulting Peru SA SEC Technical Report Summary – El Brocal | Page 127 |
Buenaventura reported inside an optimized pit shell for open pit zone, considering that, for both lead and zinc ore zones, as well as the copper zone, which have different destinations in the metallurgical plant. Buenaventura reported inside an stope shell for underground zone.
The details of the Mineral Resources report of the mine are shown in Table 11-26, Table 11-27 and Table 11-28.
Table 11-26: Zn-Pb Mineral Resources Statement, Open Pit, El Brocal Mine, Department of Pasco - Peru, December 31, 2021.
Resources | Category | Tonnes | Ag | Pb | Zn | Cu | As | Fe | NSR |
000's | Oz/t | % | % | % | % | % | US$/t | ||
Zn-Pb ore | Measured | 1,089 | 0.47 | 1.25 | 3.78 | 0.01 | 0.00 | 17.71 | 42.51 |
Indicated | 1,292 | 1.22 | 0.91 | 3.05 | 0.07 | 0.03 | 13.48 | 48.76 | |
Measured & Indicated | 2,381 | 0.88 | 1.06 | 3.39 | 0.04 | 0.02 | 15.41 | 45.90 | |
Inferred | 1,986 | 3.31 | 0.33 | 1.02 | 0.07 | 0.09 | 8.69 | 65.63 |
Source: Buenaventura, 2021 (Buenaventura, 2021)
Table 11-27: Cu Mineral Resources Statement, Open Pit, El Brocal Mine, Departament of Pasco - Peru, December 31, 2021.
Resources | Category | Tonnes | Ag | Pb | Zn | Cu | As | Fe | NSR |
000’s | Oz/t | % | % | % | % | % | US$/t | ||
Cu ore | Measured | 28 | 4.48 | 0.25 | 0.44 | 2.95 | 0.66 | 4.88 | 196.32 |
Indicated | 1,173 | 0.83 | 0.11 | 0.23 | 1.72 | 0.44 | 7.34 | 85.91 | |
Measured & Indicated | 1,201 | 0.92 | 0.12 | 0.23 | 1.75 | 0.44 | 7.28 | 88.49 | |
Inferred | 13,844 | 0.49 | 0.08 | 0.07 | 1.54 | 0.39 | 11.77 | 73.05 |
Source: Buenaventura, 2021 (Buenaventura, 2021)
Table 11-28: Cu Mineral Resources Statement, Underground Mine, El Brocal, Department of Pasco - Peru, December 31, 2021.
Resources | Category | Tonnes | Ag | Cu | Au | As | Fe | NSR |
000’s | Oz/t | % | g/t | % | % | US$/t | ||
Cu ore | Measured | 893 | 1.33 | 2.64 | 1.04 | 0.86 | 19.17 | 152.56 |
Indicated | 28,704 | 0.80 | 1.59 | 0.87 | 0.53 | 20.43 | 92.35 | |
Measured & Indicated | 29,597 | 0.81 | 1.62 | 0.88 | 0.54 | 20.39 | 94.17 | |
Inferred | 19,679 | 0.73 | 1.76 | 0.80 | 0.53 | 16.31 | 98.77 |
Source: Buenaventura, 2021 (Buenaventura, 2021)
Notes to accompany Mineral Resources tables:
| ● | The reference point for the Mineral Resources estimate is insitu. The estimate has an effective date of 31 december, 2021. The Qualified Person Firm responsible for the resource estimate is SRK Consulting (Peru) S.A. |
| ● | Mineral Resources are reported exclusive of those Mineral Resources converted to mineral reserves. Mineral Resources that are not mineral reserves do not have demonstrated economic viability. |
| ● | Resources have been reported as in situ (hard rock within optimized pit shell and stopes). |
SRK Consulting (Peru) S. A. | May, 2022 |
SRK Consulting Peru SA SEC Technical Report Summary – El Brocal | Page 128 |
| ● | Resources have been categorized subject to the opinion of a QP based on the amount/robustness of informing data for the estimate, consistency of geological/grade distribution, survey information, and have been validated against long term mine reconciliation for the in-situ volumes. |
| ● | The estimate uses the following key input parameters: commodity prices of 8,000 USD / t Cu, 1,600 USD / Oz Au, 25 USD / Oz Ag, 2,286 USD / t Pb and 2,385 USD / t Zn; life-of-mine average metallurgical recoveries was assigned to the block model using defined functions, sublevel stopping mining method is considered; inclusion of internal and external dilution; mining costs; processing costs; no allocation for general and administrative costs; and an allocation for sustaining capital cost. All these parameters can be seen in detail in Table 11-21, 11-22, 11-23 and 11-24. |
| ● | Mineral Resources are reported inside optimized pit and optimized stopes designed above a net smelter return cut-off of: for Open Pit: Zn: 27.14 USD / t ; Cu: 25.95 USD / t; and for Underground: North an Center: 38.94 USD / t; Southeast and Southwest: 37.49 USD / t and Southwest 2 and South: 41.12 USD / t |
| ● | The NSR equations are: |
| - | Open Pit: GradeZn(%)*11.12*Recovery Zn(%)+GradeAg(Oz/t)*15.87*Recovery AgZn(Oz/t)+GradePb(%)*12.93*Recovery Pb(%)+GradeAg(Oz/t)*21.36*Recovery AgPb(Oz/t))/100 |
| - | Underground: GradeCu(%)*48.58*Recovery Cu(%)+GradeAu(g/t)*30.86*Recovery Au(g/t)+GradeAg(Oz/t)*19.18*RecoveryAg(Oz/t))/100 |
| ● | Mineral Resources tonnage and contained metal have been rounded to reflect the accuracy of the estimate, and numbers may not add due to rounding. |
11.5.11Mineral Resources Sensitivity
Factors that may affect estimates include metal price and exchange rate assumptions; changes in the assumptions used to generate the cut-off grade; changes in local interpretations of the geometry of mineralization and continuity of mineralized zones; changes in geological form and mineralization and assumptions of geological and grade continuity; variations in density and domain assignments; geometallurgical assumptions; changes in geotechnical, mining, dilution and metallurgical recovery assumptions; switch to design and input parameter assumptions pertaining to conceptual stope designs that constrain estimates; and assumptions as to the continued ability to access the site, retain title to surface and mineral rights, maintain environmental and other regulatory permits, and maintain the social license to operate.
There are no other known environmental, legal, title, tax, socioeconomic, marketing, political or other factors that could materially affect the estimate of Mineral Resources or Mineral Reserves that are not discussed in this Report.
To demonstrate the sensitivity of the El Brocal Mineral Resources to metal value cut-off, a grade-tonnage curve was developed to show changes in Mineral Resources tonnage and copper and zinc grade to changes in the metal value cut-off. A grade-tonnage curve was estimated for each mining zone and method to show the effect of varying the NSR cut-off value in tonnes and the NSR value. (Figure 11-23, Figure 11-24 and Figure 11-25)
SRK Consulting (Peru) S. A. | May, 2022 |
SRK Consulting Peru SA SEC Technical Report Summary – El Brocal | Page 129 |
Figure 11-23: Grade-Tonnage Curve for measured and indicated Mineral Resources for Open Pit (Zinc Zone).
Source: Buenaventura, 2021 (Buenaventura, 2021)

Figure 11-24: Grade-Tonnage Curve for measured and indicated Mineral Resources for Open Pit (Copper Zone).
Source: Buenaventura, 2021 (Buenaventura, 2021)

Figure 11-25: Grade-Tonnage Curve for measured and indicated Mineral Resources for Underground.
Source: Buenaventura, 2021 (Buenaventura, 2021)
SRK Consulting (Peru) S. A. | May, 2022 |
SRK Consulting Peru SA SEC Technical Report Summary – El Brocal | Page 130 |
Mineral Reserve Estimates |
El Brocal is an operating mine that uses conventional open pit and underground methods to extract mineral reserves. The underground mining method used is Room and Pillar, with variations of backfill and mining sequence that are adapted to the shape of the ore deposit and ground conditions. Additionally, the SLS mining method is considered in the Life of Mine plan using primary and secondary stopes with cemented backfill. Separate mineral reserve estimates were generated for the open pit and underground mines. A combined mineral reserve statement is provided in Section 12.6. The open pit and underground mining areas are located entirely on land owned by Buenaventura or under surface use agreements with the owners. There are no royalties applicable on the reported mineral reserves areas.
Proven and probable mineral reserves are converted from measured and indicated Mineral Resources. Conversion is based on pit optimization results (only open pit), mine design, mine sequence and economic evaluation. The in situ value is calculated from the estimated grade and certain modifying factors.
The mine LoM plans and resulting mineral reserves stated in this report are based on pre-feasibility level studies.
Mineral reserves effective date is December 31st, 2021
Open Pit Mineral Reserves |
Introduction |
The open-pit mineral reserves are located in one main open pit location. Material is hauled by truck from the pit to an existing crusher facility located on the west side of the open pit. Waste material is hauled by truck to the appropriate waste dump location.
A regularized block model used has a cell size of 4 m x 4 m x 6 m. This block size is considered appropriate for the mining cycle at El Brocal. A dilution between 10% and 44% was introduced for the ore blocks located in the boundary ore-waste materials and an ore loss of 2% was considered for the ore materials in general. No further ore losses or ore dilution were applied.
Key Assumptions, Parameters, and Methods Used |
The open pit mineral reserves are reported within a pit design based on open pit optimization results. The optimization included measured and indicated Mineral Resources categories. The pit shell used to define mineral reserves was based on a selected Revenue Factor 1.00 shell. This choice is aligned with a policy of El Brocal to maximize the LoM to confirm inferred resources and adequate delimitation of the ore located in zones adjacent to older underground operations. Inferred material (approximately 30% of measured and indicated resources) within the reserve pit design was treated as waste and given a zero value. Optimization carried out in Minesight® software and parameters are shown in Table 12-1.
Table 12-1: Lerchs & Grossmann Optimization Parameters
Parameter | Unit | Value |
|---|---|---|
Base mining cost | US$/t rock | 1.87 |
Incremental mining cost (by bench) * | US$/t rock | 0.013 |
Processing cost |
|
|
Plant Cu | US$/t ore | 17.47 |
SRK Consulting (Peru) S. A. | May, 2022 |
SRK Consulting Peru SA SEC Technical Report Summary – El Brocal | Page 131 |
Parameter | Unit | Value |
|---|---|---|
Plant PbZn | US$/t ore | 16.28 |
G&A cost | US$/t ore | 6.84 |
Metallurgical recovery ** | % | By function |
Mill throughput |
|
|
Plant Cu (Plant 1) | t/day | 8,000 |
Plant PbZn (Plant 2) | t/day | 10,500 |
Royalties | % | 0.00 |
Source: Buenaventura (compiled and verified by SRK) | ||
* Incremental cost is calculated in reference to the ramp exit level | ||
** Metallurgical recovery was assigned to the block model using defined functions | ||
Geotechnical Parameters
The open pit slope angles used for the pit optimization and mine design are based on geotechnical studies and range from 31° to 36° according to the geotechnical sectors shown in Figure 12-1.
Figure 12-1: Design recommendations for open pit design 2020
Source: SRK
Methodology
A 3D mine design, based on the selected pit shell, was completed using Minesight ® software and is the basis for the open pit reserves..
SRK Consulting (Peru) S. A. | May, 2022 |
SRK Consulting Peru SA SEC Technical Report Summary – El Brocal | Page 132 |
The steps applied in the conversion process from Mineral Resources to mineral reserves included:
| ● | Import resource block model; |
| ● | Assignment of metallurgical recoveries into an attribute of the block model; |
| ● | Identify the zones adjacent to mined underground sectors; |
| ● | Compute NSR cut-off (internal and economic); |
| ● | Compute the revenue function per block on the resource model, considering as valuable blocks those that correspond to measured and indicated categories; |
| ● | Based on the internal cut-off, determine the border of ore-waste material; |
| ● | Assignment of ore dilution of 9% (for each cell face exposed to waste) to ore blocks located on the limit with waste block. Assignment of ore loss of 2% to all ore blocks; |
| ● | Re-evaluation of border ore-waste; |
| ● | Configure geotechnical sectors and overall slope angles; |
| ● | Pit optimization using Minesight® and algorithm Lerchs and Grossmann; |
| ● | Final pit selection and push-back definition; |
| ● | Pit design based on final pit shell envelope and selected push backs; |
| ● | Validate the equipment fleet; |
| ● | Prepare a production schedule; |
| ● | Tabulate mineral reserves. |
Mining Dilution and Mining Recovery |
Dilution was assigned to the ore blocks located in the boundary with waste blocks and depends on the number of exposed faces to the waste blocks determined in an XY plan view (See Figure 12-2). The range of percentage dilution assigned is from 10% to 44%, as shown in Table 12-2.
Additional over-cost is considered for blocks around voids to cover operational mining costs (different from the recognition cost defined previously). This over-cost is calculated using the attribute of underground topography of the block model. The TOPUG attribute calculates the percentage or portion of the cell (block model) inside the underground mined solids
The function applied to calculate the over-cost is:
Over-cost = 6.85 * TopUG%
The result is expressed as US$/t
Table 12-2: OP in-situ dilution values
Number of exposed sides | Dilution in-situ |
1 | 9% |
2 | 17% |
3 | 24% |
4 | 31% |
Source: SRK, June 2021 | |
* Corresponds to n: Number of exposed faces in Figure 12-2 | |
SRK Consulting (Peru) S. A. | May, 2022 |
SRK Consulting Peru SA SEC Technical Report Summary – El Brocal | Page 133 |
Figure 12-2: Ore envelope and dilution application criterion
Source: SRK, June 2021
The assumed mining recovery was 98% (equivalent to an ore loss of 2%) applied evenly for all ore blocks.
Cut Off Grades |
An NSR cut-off was used in preference to a grade cut-off, considering that El Brocal is a polymetallic mine selling a different type of concentrates. Valuable contents are: copper, silver, lead, zinc and gold.
Cut-off grades definition are based on three last years (2018 to 2020) historical cost and consider a detailed analysis process including:
| ● | Analysis of the complete operating cost database managed through SAP System (Datamart); |
| ● | Analysis of Buenaventura corporative and headquarters costs (including non 100% Buenaventura owned subsidiary companies like El Brocal); |
| ● | Comparative analysis of Buenaventura costs reported in public domain sources; |
| ● | Identification of the one-off costs and other expenses non-related to mine operations; |
| ● | Estimation of sustaining CAPEX; |
| ● | Assessment of current and future conditions of mine operations. |
For el Brocal open pit mine, two NSR cut-off values were defined according to a common practice in an open pit reserves assessment:
| ● | Economic cut-off: including mining, processing plant and administrative costs; |
| ● | Internal cut-off: including processing plant and administrative costs. |
SRK Consulting (Peru) S. A. | May, 2022 |
SRK Consulting Peru SA SEC Technical Report Summary – El Brocal | Page 134 |
Mineral reserves and delimitation of limits for ore-waste material were stated using the internal NSR cut-off value.
Inputs for NSR cut-off calculation and estimated NSR cut-off are listed in Table 12-3 and Table 12-4.
Table 12-3: OP NSR cut-off Input parameters
Item | Unit | Value |
Mining cost |
| |
Ore | US$/t mined | 2.32 |
Waste | US$/t mined | 1.87 |
Process cost |
|
|
Plant Pb Zn | US$/t processed | 17.47 |
Plant Cu | US$/t processed | 16.28 |
General and administrative costs | US$/t processed | 6.84 |
Sustaining capital cost | US$/t processed | 1.38 |
Off site cost (corporate) | US$/t processed | 1.00 |
Source: Buenaventura, 2021 (compiled by SRK) | ||
Table 12-4: OP NSR cut-off value
Item | Unit | Value |
NSR Internal cut-off |
| |
Plant Pb Zn | US$/t processed | 27.15 |
Plant Cu | US$/t processed | 25.97 |
NSR Economic cut-off |
|
|
Plant Pb Zn | US$/t processed | 29.02 |
Plant Cu | US$/t processed | 27.84 |
Source: Buenaventura, 2021 (compiled by SRK) | ||
12.2 | Underground Mineral Reserves |
Introduction |
The underground mine is operated using Room and Pillar and Sub Level Stoping. Material is hauled by truck from the underground zone to an existing crusher facility located on the west side of the open pit.
A block model sub-bloqued to a cell size of 4 m x 4 m x 3 m is used for the underground mineral reserves estimation process. This block size is considered appropriate for the ore selectivity and mine design process. A dilution between 4% and 10% was introduced for the designed stope and an ore loss of 4% was considered for the ore materials in general. No further ore losses or ore dilution were applied.
Key Assumptions, Parameters, and Methods Used |
The underground mineral reserves are reported within mine stopes designed using the software Deswik®. Stope design included an internal dilution sourced from inferred material and non-categorized material (hanging wall and footing wall).
SRK Consulting (Peru) S. A. | May, 2022 |
SRK Consulting Peru SA SEC Technical Report Summary – El Brocal | Page 135 |
Stope designs are generated automatically using the “Deswik stope optimizer” (DSO) included as a module of Deswik® software. Parameters for the application of DSO algorithm are according to the geotechnical evaluation detailed in Section Error! Reference source not found..
Mineral reserves definition process was developed considering specific conditions of the mining method, which allow differentiated parameters and operating cost schemas. Mining methods (including variations) considered are:
SLS
Mining in a sequence of primary and secondary stopes using cemented backfill in the primary stopes to allow the access into the secondary stopes.
R&P primary stopes
Mining longitudinal stopes leaving intermediate pillars to guarantee ground stability
R&P pillar recovery w/ cemented backfill
Recovery of pillars left by previous mining underground operations. Considering the ground conditions, it is necessary to fill the cavities adjacent to the pillar using cemented backfill to guarantee stability during mining operations to recover pillars.
R&P remanent
This entails recovering pillars left during the mining operations in the past periods in zones that are not adjacent to the current operation. For this mining, it will be necessary to apply preparation adits or by-pass to allow access to the operation zone
Designed stopes and their internal materials consider the following criteria:
| ● | Characteristics of material inside the stope wireframe are calculated considering it as a unique entity, including total tonnage, diluted grades and diluted NSR; |
| ● | The Mineral Resources category assigned to the whole material inside the wireframe corresponds to the lowest category existing inside the solid. Due to this process, part of material initially categorized as measured resources is reassigned to indicated resources and, as a consequence, becomes part of probable reserves; |
| ● | An additional dilution percentage was considered for external (or unplanned) dilution. This percentage is assigned evenly to the reported material inside designed stopes wireframes; |
| ● | Inferred and non-categorized material within the stope designed wireframes was treated as waste and given a zero value (grade and NSR). |
For dilution purposes and according to geotechnical evaluation, the expected rock overbreak is between 0.40 m to 0.50 m in the hanging wall and footing wall. ELOS parameter used in the configuration of DSO for mine design stopes process is 0.45 m.
Methodology
A 3D mine design, was completed using Deswik® software and is the basis for the underground reserves.
The steps applied in the conversion process from Mineral Resources to mineral reserves included:
| ● | Import resource block model; |
| ● | Assignment of metallurgical recoveries into an attribute of the block model; |
| ● | Compute NSR cut-off (economic and marginal); |
| ● | Compute economic revenue per block of the resource model (measured and indicated categories); |
SRK Consulting (Peru) S. A. | May, 2022 |
SRK Consulting Peru SA SEC Technical Report Summary – El Brocal | Page 136 |
| ● | Identify and analyze the economic envelope (revenue ≥ NSR cut-off); |
| ● | Identify the isolated and remote zones with regard to main operating zones or in relation to the principal zone defined as Mineral Resources; |
| ● | Design mine development , access and preparation headings for new mining areas; |
| ● | Set up Deswik® “Deswik Stope Optimiser” (DSO) module with mining unit dimension, mining dilution and NSR cut-off; |
| ● | Run Deswik® DSO module in the economic envelope. Review and adjust inputs as necessary, rerun Deswik DSO module in the economic envelope as needed; |
| ● | Validate the equipment fleet; |
| ● | Preliminary reserve confidence categories whereby measured and indicated Mineral Resources portions of stopes were modified to proven and probable mineral reserves respectively; |
| ● | Final operational and economic stope review (only stopes that have mineral reserves classified) to eliminate stopes that do not comply with the pre-set operational and economic criteria; |
| ● | Mine planning; |
| ● | Tabulate mineral reserves |
Mining Dilution and Mining Recovery |
Mining dilution and mining recovery for each stope were estimated taking into consideration the planned mining method and stope design.
Mining dilution is assumed to be from an inferred resource, non-categorized material or low-grade material entering the stope during mining, backfilling material and shotcrete. Mining dilution was incorporated considering two sources:
| ● | Internal or planned dilution corresponds to material included as part of designed stopes that is different from measured or indicated Mineral Resources; |
| ● | External or unplanned dilution is generated by the impact of different activities of the mining cycle (blasting, loading, hauling, others). This material is included in the form of a percentage allowance of the in-situ estimated tonnage of the stope. |
Mining dilution formula used for the mineral reserves estimation and calculations is:

Mining recovery was defined on the basis of historical topographic records and tracked stopes, which were monitored with CMS (Cavity Monitoring System) to measure and control mining recovery and mining dilution percentages. There were 180 stopes monitored with CMS in 2019 and 2020.
The mining method used is Room and Pilar, including variations of mining sequence (primary and secondary stopes), backfill type and specific operational aspects.
Consolidated values for mining recovery and mining dilution are shown in Table 12-55.
Table 12-5: Underground in-situ dilution values
Mining Method | Dilution | Recovery |
|---|---|---|
R&P Primary | 4% | 95% |
R&P Pillar Recov | 10% | 95% |
R&P Remanent | 4% | 95% |
SRK Consulting (Peru) S. A. | May, 2022 |
SRK Consulting Peru SA SEC Technical Report Summary – El Brocal | Page 137 |
Mining Method | Dilution | Recovery |
|---|---|---|
SLS | 4% | 95% |
Source: Buenaventura, 2021 (reviewed by SRK) | ||
* R&P: refers to Room and Pîllar mining method | ||
12.2.4 | Cut Off Grades |
An NSR cut-off was used rather than a grade cut-off, considering that El Brocal is a polymetallic mine that sells a different type of concentrates. Valuable contents are: copper, silver, lead, zinc and gold.
Cut-off grades definition are based on the historical cost of the last three years (2018-2020) and consider a detailed analysis process including:
| ● | Analysis of the complete operating cost database managed through SAP System (Datamart); |
| ● | Analysis of Buenaventura corporative and headquarters costs (including non 100% Buenaventura owned subsidiary companies like El Brocal); |
| ● | Comparative analysis of Buenaventura costs reported in public domain sources. |
| ● | Identification of the one-off costs and other expenses non-related to mine operations; |
| ● | Estimation of sustaining CAPEX; |
| ● | Assessment of current and future conditions of mine operations. |
For El Brocal underground mine, five variances of mining method were considered and for each mining method, two NSR cut-off values were defined:
| ● | Economic cut-off: including fixed and variable costs for mining, processing plant and administrative costs; |
| ● | Marginal cut-off: including only variable cost. |
Mineral reserves were stated using the marginal NSR cut-off value.
Inputs for NSR cut-off calculation and estimated NSR cut-off are listed in Table 12-6 and Table 12-7.
Table 12-6: NSR cut-off Input parameters for underground operations
Item | Unit | R&P | R&P | R&P | SLS |
Mining cost | US$/t ore | 27.88 | 29.33 | 29.15 | 31.51 |
Process cost - Plant Cu | US$/t processed | 16.28 | 16.28 | 16.28 | 16.28 |
General and Adm. costs | US$/t processed | 6.84 | 6.84 | 6.84 | 6.84 |
Sustaining capital cost | US$/t processed | 2.29 | 2.29 | 2.29 | 2.29 |
Off site cost (corporate) | US$/t processed | 1.47 | 1.47 | 1.47 | 1.47 |
Source: Buenaventura, 2021 (compiled by SRK) | |||||
SRK Consulting (Peru) S. A. | May, 2022 |
SRK Consulting Peru SA SEC Technical Report Summary – El Brocal | Page 138 |
Table 12-7: NSR cut-off value for underground operations
Item | Unit | R&P | R&P | R&P | SLS |
|---|---|---|---|---|---|
NSR Economic cut-off |
|
|
|
| |
Plant Cu | US$/t processed | 54.76 | 56.21 | 56.03 | 58.39 |
NSR Marginal cut-off |
|
|
|
|
|
Plant Cu | US$/t processed | 37.49 | 38.94 | 38.76 | 41.12 |
Source: Buenaventura, 2021 (compiled by SRK) | |||||
12.3 | Metallurgical Recovery |
El Brocal operates two plants (Plant 1: Cu, Plant 2: Pb-Zn) and produces three types of concentrates (copper, zinc and lead). Metallurgical recoveries were estimated considering operational conditions and were assigned to the block model as an attribute. Currently Plant 2 process copper ore by camapigns of approximately 30 days/ year.
Recovery percentages are defined using formulas and grade range of application (when it applies). These formulas were developed based on:
● Analysis of the last three years of statistical data and metallurgical performance of the plant;
● Historical metallurgical testing results, and the latest results (2021) from the metallurgical testing campaign using representative samples collected from the mineral reserves sectors.
Using the available information from the mining and metallurgical disciplines, SRK developed specific mathematical expressions for the Copper Plant and the Lead-Zinc Plant. Data support and details of analysis (formulas and graphic representation) are included in chapters 10 and 14.
SRK considers that there are significant room to improve the accuracy of the mathematical expressions, and strongly recommends continuing efforts to collect detailed operational data as well as executing metallurgical tests to increase the accuracy of the Reserves & Resources estimates.
Curves and formulas are shown as follows by plant and element according to plants and products showed in Table 12-88.
Table 12-8: El Brocal processing plants and products
Plant | Throughput (tpd) | Saleable | Recoverable |
Plant 1 | 8,000 | Copper | Copper |
Silver | |||
Gold | |||
Plant 2 ** | 10,500 | Lead | Lead |
Silver | |||
Zinc | Zinc | ||
Silver | |||
Source: Buenaventura, 2021 (compiled by SRK) | |||
* By contract, other elements can be payable. Listed elements are considered for mineral reserves estimation purposes | |||
** Plant 2 can process Copper ores by campaigns at 9,500 tpd | |||
For material processed through Plant 1 (Copper), functions are detailed in Table 12-99 and graphs are shown in in Figure 12-3, Figure 12-4 and Figure 12-5, differentiated by metal and grade ranges.
SRK Consulting (Peru) S. A. | May, 2022 |
SRK Consulting Peru SA SEC Technical Report Summary – El Brocal | Page 139 |
Table 12-9: Metallurgical recovery functions - Copper Concentrate
Metal | Applicable Grade Range | Metallurgical Recovery function * |
Cu | Cu Grade (%) <= 0.20 | 0.00 |
0.20 < Cu Grade (%) <= 0.70 | [ Cu Grade (%) - 0.20 ] / Cu Grade (%) | |
0.70 < Cu Grade (%) <= 1.935 | LN [ Cu Grade (%) ] * 0.205 + 0.794 | |
1.935 < Cu Grade (%) <= 2.50 | 0.05074 * Cu Grade (%) + 0.82932 | |
2.50 < Cu Grade (%) | 0.96 | |
Ag | Ag Grade (oz/t) <= 0.12 | 0.00 |
0.12 < Ag Grade (oz/t) <= 0.29 | [ Ag Grade (oz/t) - 0.12 ] / Ag Grade (oz/t) | |
0.29 < Ag Grade (oz/t) <= 2.00 | 0.0665 * Ag Grade (oz/t) + 0.56669 | |
2.00 < Ag Grade (oz/t) | 0.70 | |
Au | Au Grade (g/t) <= 0.12 | 0.00 |
0.12 < Au Grade (g/t) <= 0.20 | [ Au Grade (g/t) - 0.12 ] /Au Grade (g/t) | |
0.20 < Au Grade (g/t) <= 1.00 | 0.047582 * Au Grade (g/t) + 0.40008 | |
1.00 < Au Grade (g/t) <= 1.50 | 0.344 * Au Grade (g/t) + 0.1040 | |
1.50 < Au Grade (g/t) | 0.62 | |
Source: SRK, 2021 | ||
* Grades expressed as a percentage must be considered as decimal numbers in the recovery functions | ||

Figure 12-3: Cu recovery in Copper Concentrate
Source: SRK, 2021
SRK Consulting (Peru) S. A. | May, 2022 |
SRK Consulting Peru SA SEC Technical Report Summary – El Brocal | Page 140 |

Figure 12-4: Ag recovery in Copper Concentrate
Source: SRK, 2021
Figure 12-5: Au recovery in Copper Concentrate
Source: SRK, 2021
For material processed through Plant 2 (Lead & Zinc), functions were developed for Lead concentrate and Zinc concentrate.
Lead concentrate functions are detailed in Table 12-10 and its corresponding graphs are shown in Figure 12-6 and Figure 12-7, differentiated by metal and grade ranges. Lead recovery in Lead Concentrates depends on the presence of oxidation (represented by PbOx grades).
SRK Consulting (Peru) S. A. | May, 2022 |
SRK Consulting Peru SA SEC Technical Report Summary – El Brocal | Page 141 |
Table 12-10: Metallurgical recovery functions - Lead Concentrate
Metal | Applicable Grade Range | Metallurgical Recovery function * |
Pb ** *** | 0.00 < [ (Pb Grade (%) - PbOx (%) ] <= 0.40 | [ Pb Grade (%) - PbOx (%) ] * 0.80 / Pb Grade (%) |
0.40 < [ (Pb Grade (%) - PbOx (%) ] <= 0.80 | [ Pb Grade (%) - PbOx (%) ] * 0.85 / Pb Grade (%) | |
0.80 < [ (Pb Grade (%) - PbOx (%) ] | [ Pb Grade (%) - PbOx (%) ] * 0.90 / Pb Grade (%) | |
Ag | 0.00 < Ag Grade (oz/t) <= 0.12 | 0.00 |
0.12 < Ag Grade (oz/t) <= 0.29 | [ Ag Grade (oz/t) - 0.12 ] / Ag Grade (oz/t) | |
0.29 < Ag Grade (oz/t) <= 2.00 | 0.0665 * Ag Grade (oz/t) + 0.56669 | |
2.00 < Ag Grade (oz/t) | 0.70 | |
Source: SRK, 2021 | ||
* Grades expressed as a percentage must be considered in the same units in the recovery functions | ||
** Pb Grade refers to the total content of Lead. PbOx refers to the Lead Oxide content (expressed as a percentage) | ||
*** Pb recovery functions are applicable only if [ Pb Grade > 0 ] AND [ Pb Grade - PbOx > 0 ]. Otherwise metallurgical recovery must be considered as zero | ||
Figure 12-6: Pb recovery in Lead Concentrate
Source: SRK, 2021
SRK Consulting (Peru) S. A. | May, 2022 |
SRK Consulting Peru SA SEC Technical Report Summary – El Brocal | Page 142 |

Figure 12-7: Ag recovery in Lead Concentrate
Source: SRK, 2021
Zinc concentrate functions are detailed in Table 12-11 and its corresponding graphs are shown in Figure 12-8 and Figure 12-9, differentiated by metal and grade ranges. Zinc recovery in Zinc Concentrates depends on the presence of oxidation (represented by ZnOx grades) and the presence of Fe. Low grades of Fe (below 9.6 %Fe) show higher recoveries than high grades of Fe.
Table 12-11: Metallurgical recovery functions - Zinc Concentrate
Metal | Applicable Grade Range | Metallurgical Recovery function * | |
Zn ** *** | Fe>9.6% | 0.00 < [ (Zn Grade (%) - ZnOx (%) ] <= 0.40 | [ [ Zn Grade (%) - ZnOx (%) ] - [ Fe Grade (%) - 9.6 ] |
0.40 < [ (Zn Grade (%) - ZnOx (%) ] <= 0.80 | [ [ Zn Grade (%) - ZnOx (%) ] - [ Fe Grade (%) - 9.60 ] | ||
0.80 < [ (Zn Grade (%) - ZnOx (%) ] <= 2.50 | [ [ Zn Grade (%) - ZnOx (%) ] - [ Fe Grade (%) - 9.60 ] | ||
Fe<=9.6% | 0.00 < [ (Zn Grade (%) - ZnOx (%) ] <= 0.40 | [ Zn Grade (%) - ZnOx (%) ] * 0.60 / Zn Grade (%) | |
0.40 < [ (Zn Grade (%) - ZnOx (%) ] <= 0.80 | [ Zn Grade (%) - ZnOx (%) ] * 0.65 / Zn Grade (%) | ||
0.80 < [ (Zn Grade (%) - ZnOx (%) ] <= 2.50 | [ Zn Grade (%) - ZnOx (%) ] * 0.68 / Zn Grade (%) | ||
All | 2.50 < [ (Zn Grade (%) - ZnOx (%) ] | 0.68 | |
Ag | 0.00 < Ag Grade (oz/t) <= 0.35 | 0.00 | |
0.35 < Ag Grade (oz/t) | 0.249 | ||
Source: SRK, 2021 | |||
* Grades expressed as a percentage must be considered in the same units in the recovery functions | |||
** Zn Grade refers to the total content of Zinc. ZnOx refers to the Zinc Oxide content (expressed as a percentage) | |||
*** Zn recovery functions are applicable only if [ Zn Grade > 0 ] AND [ Zn Grade - ZnOx > 0 ]. Otherwise metallurgical recovery must be cosidered as zero | |||
SRK Consulting (Peru) S. A. | May, 2022 |
SRK Consulting Peru SA SEC Technical Report Summary – El Brocal | Page 143 |
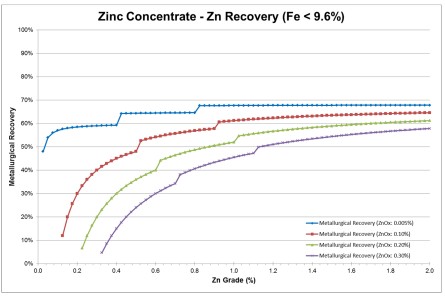
Figure 12-8: Zn recovery in Zinc Concentrate (Fe <= 9.6%)
Source: SRK, 2021

Figure 12-9: Ag recovery in Zinc Concentrate
Source: SRK, 2021
NSR Block value |
El Brocal is a polymetallic mine operation, producing 3 types of concentrates. In this sense, the mineral reserves were estimated under the concept of multiple commodity ore based on the following products:
| ● | Concentrate Cu (by-products: Ag, Au) |
| ● | Concentrate Pb (by-product: Ag) |
| ● | Concentrate Zn (by-product: Ag) |
NSR block value estimation considers the contribution of the different elements that generate value in the sale of concentrates, taking into consideration the following aspects:
| ● | Metal prices; |
SRK Consulting (Peru) S. A. | May, 2022 |
SRK Consulting Peru SA SEC Technical Report Summary – El Brocal | Page 144 |
| ● | Metallurgical recovery, included as an attribute in the block model; |
| ● | Payable contents in the saleable product; |
| ● | Commercial deductions, as such: RC, TC, penalties; |
| ● | Selling expenses, as such: transport, insurance, supervision, sampling, logistic costs. |
NSR value calculation uses a serie of “unit values” calculated for each metal, which contributes to the saleable products' value. The “unit value” consolidates the into a unique factor the following aspects into a unique factor: payable contents, commercial deductions and selling expenses.
Metal prices were stated by Buenaventura, based on market study and long-term consensus sources. Metal prices are listed in Table 12-12 and are coherent with the results of Market Study (Chapter 16) carried out by CRU Group.
Table 12-12: Metal Prices for mineral reserves definition
Metal and Units | Price |
Copper (US$/t) | 8,000 |
Silver (US$/oz) | 25 |
Lead (US$/t)an | 2,286 |
Zinc (US$/t) | 2,385 |
Source: Buenaventura |
Due to the complexity of El Brocal mineralization and multiple saleable products, several contracts are managed by El Brocal to commercialize its products. Currently, El Brocal has nine active contracts with different traders (two to four for each type of concentrate) with terms between one to three years.
Unit values calculated used to determine the NSR block value are shown in Table 12-13.
Table 12-13: Estimated unit value by metal and type of concentrate
Concentrate | Unit value by Metal (US$ / unit of grade) * | ||||
Au | Ag ** | Pb | Zn | Cu | |
Copper concentrate | 30.86 | 19.18 |
|
| 48.58 |
Lead concentrate |
| 21.36 | 12.93 |
|
|
Zinc concentrate |
| 15.87 |
| 11.12 |
|
Grade units *** | Au (g/t) | Ag (oz/t) | Pb (%) | Zn (%) | Cu (%) |
Source: Buenaventura (verified by SRK) | |||||
* Unit value is used as a factor (multiplied by recoverable content) to calculate the value contribution (US$/t) | |||||
** For silver, the "unit value" applies only to the portion of silver grade recoverable in each concentrate | |||||
*** Grades must be expressed in the indicated units to use the formula | |||||
12.5 | Material Risks Associated with the Modifying Factors |
SRK has identified the following material risks associated with the modifying factors:
Mining Dilution and Mining Recovery:
The mining dilution estimate depends on the accuracy of the resource model as it relates to internal waste. LOM considers the uses of Room and Pillar and Sub Level Stoping mining methods using cemented backfill. SRK considers that dilution and mine recovery assumed is reasonable but
SRK Consulting (Peru) S. A. | May, 2022 |
SRK Consulting Peru SA SEC Technical Report Summary – El Brocal | Page 145 |
requires deeper analysis, and it represents a risk that could impact grades and tonnage of Run of Mine ore.
Impact of Currency Exchange Rates on Production Cost:
The operating costs are modeled in US Dollars (US$) within the cash flow model. The foreign exchange rate profile has not been analyzed in detail. Considering that only a portion of the cost and expenses are in local currency (Peruvian Soles) and given the high variability of the exchange rate over the last two years, the operating cost could be impacted.
Additionally, inflation rates, which were very stable in Peru over the ten years prior to 2021, have started to show variations and their evolution down the line is unpredictable.
Geotechnical Parameters:
Geotechnical parameters used to estimate the mineral reserves can change as mining progresses. Local slope failures could force the operation to adapt to a lower slope angle which would cause the strip ratio to increase and the economics of the pit to change.
Processing Plant Throughput:
The mine plan shows yearly periods in which the total ore processed corresponds to copper ore. This condition requires that both plants (1 and 2) will operate to produce only copper concentrates. There are no antecedents of both plants working on copper ore treatment on a permanent basis, which could cause an impact on the operational cost or processing capacity. Currently Plant 2 process copper ore by campaigns of approximately 30 days/ year.
Politics:
Uncertainty in the local political situation can generate impacts on the cost, facilities, or conditions to operate the mining unit, in consequence, a possible impact on the mineral reserves would occur,
Deleterious elements:
Contents of Arsenic in the ore and the saleable concentrates require particular conditions to commercialize the copper concentrates. Currently, Buenaventura has contracts with smelters to treat this type of concentrates. The possible impact on the options to commercialize these products in the future can be related to: increasing constraints or limits to commercializing this type of concentrates (stated by smelters or regulators) and an increase in the Arsenic contents of saleable products (as results of mining operations).
Mineral Reserves Statement |
The conversion of Mineral Resources to mineral reserves has been completed in accordance with CFR 17, Part 229 (S-K 1300). The reserves are based on open pit and underground operations. Appropriate modifying factors have been applied as previously discussed. The positive economics of the mineral reserves have been confirmed by LoM production scheduling and cash flow modeling as discussed in sections Error! Reference source not found. and Error! Reference source not found. of this report, respectively.
The reference point for the mineral reserve estimate is the point of delivery to the process plant. The Qualified Person Firm responsible for the estimate is SRK consulting (Peru) SA.
In the QP’s opinion, the mineral reserves estimation is reasonable in the context of the available technical studies and information provided by Buenevantura.
Table 12-14 and Table 12-15 shows the El Brocal mineral reserves as of December 31st, 2021.
SRK Consulting (Peru) S. A. | May, 2022 |
SRK Consulting Peru SA SEC Technical Report Summary – El Brocal | Page 146 |
Table 12-14: El Brocal Underground Summary Mineral Reserve Statement as of December 31st, 2021
Mining | Confidence | Tonnage | Copper | Silver | Gold | Arsenic |
R&P | Proven | 35 | 1.18 | 31.35 | 0.69 | 0.38 |
Probable | 13,918 | 1.24 | 21.83 | 1.00 | 0.40 | |
Sub-total | 13,953 | 1.24 | 21.85 | 1.00 | 0.40 | |
R&P | Probable | 873 | 1.92 | 11.87 | 0.24 | 0.55 |
Sub-total | 873 | 1.92 | 11.87 | 0.24 | 0.55 | |
R&P | Probable | 751 | 1.72 | 17.74 | 0.72 | 0.57 |
Sub-total | 751 | 1.72 | 17.74 | 0.72 | 0.57 | |
SLS | Probable | 16,908 | 1.33 | 23.35 | 0.61 | 0.50 |
Sub-total | 16,908 | 1.33 | 23.35 | 0.61 | 0.50 | |
TOTAL | Proven | 35 | 1.18 | 31.35 | 0.69 | 0.38 |
Probable | 32,450 | 1.32 | 22.26 | 0.77 | 0.46 | |
Total | 32,485 | 1.32 | 22.27 | 0.77 | 0.46 |
Source: SRK, 2021
Underground reported mineral reserves tonnage, grades and contained metal correspond to the total underground mineral reserves. Buenaventura's attributable portion of Mineral Resources and reserves is 61.00% | ||
(2) | The reference point for the mineral reserve estimate is the point of delivery to the process plant. | |
(3) | Mineral reserves are current as of December 31st, 2021 and are reported using the mineral reserve definitions in S-K 1300. The Qualified Person Firm responsible for the estimate is SRK Consulting (Peru) SA | |
(4) | Key parameters used in mineral reserves estimate include: | |
(a) | Average long-term prices of copper price of 8,000 US$/t, gold price of 1,600 US$/oz, silver price of 25.00 US$/oz, lead price of 2,286 US$/t, zinc price of 2,385 US$/t | |
(b) | Variable metallurgical recoveries are accounted for in the NSR calculations and defined according to recovery functions, that average 84% for copper, 35% for gold and 52% for silver | |
(c) | Mineral reserves are reported above a marginal net smelter return cut-off of 37.49 US$/t for room & pillar primary stopes, 38.94 US$/t for pillar recovery with cemented backfill, 38.76 US$/t for remanent ore recovery and 41.12 US$/t for sub level stoping mining methods. | |
(d) | Underground ore is scheduled to be processed mainly in the Plant 1 (used to process Copper ore) | |
(5) | Mineral reserves tonnage, grades and contained metal have been rounded to reflect the accuracy of the estimate, and numbers may not add due to rounding | |
SRK Consulting (Peru) S. A. | May, 2022 |
SRK Consulting Peru SA SEC Technical Report Summary – El Brocal | Page 147 |
Table 12-15: El Brocal Open Pit Summary Mineral Reserve Statement as of December 31st, 2021
Ore type | Confidence | Tonnage | Copper | Silver | Gold | Lead | Zinc | Arsenic | |
|---|---|---|---|---|---|---|---|---|---|
Copper Ore | Proven | 2,288 | 2.35 | 96.48 | 0.01 |
|
| 0.21 | |
Probable | 24,059 | 1.64 | 15.56 | 0.24 |
|
| 0.43 | ||
Sub-total | 26,347 | 1.70 | 22.59 | 0.22 |
|
| 0.41 | ||
Lead-Zinc Ore | Proven | 4,789 |
| 91.55 |
| 1.37 | 2.65 | 0.05 | |
Probable | 3,418 |
| 91.92 |
| 0.70 | 1.44 | 0.10 | ||
Sub-total | 8,207 |
| 91.70 |
| 1.09 | 2.15 | 0.07 | ||
Source: SRK, 2021 | |||||||||
(1) | Open pit reported mineral reserves tonnage, grades and contained metal correspond to the total open pit mineral reserves. Buenaventura's attributable portion of Mineral Resources and reserves is 61.00% | |
(2) | The reference point for the mineral reserve estimate is the point of delivery to the process plant. | |
(3) | Mineral reserves are current as of December 31st, 2021 and are reported using the mineral reserve definitions in S-K 1300. The Qualified Person Firm responsible for the estimate is SRK Consulting (Peru) SA | |
(4) | Key parameters used in mineral reserves estimate include: | |
(a) | Average long-term prices of copper price of 8,000 US$/t, gold price of 1,600 US$/oz, silver price of 25.00 US$/oz, lead price of 2,286 US$/t, zinc price of 2,385 US$/t | |
(b) | Variable metallurgical recoveries are accounted for in the NSR calculations and defined according to recovery functions, that average for | |
(c) | Mineral reserves are reported above an internal net smelter return cut-off of 27.14 US$/t for open pit ore sent to Plant 2 (PbZn) and 25.95 US$/t for open pit ore sent to Plant 1 (Cu) | |
(e) | Open pit ore is scheduled to be processed in the Plant 1 (Copper ore) and Plant 2 (Lead-Zinc ore) | |
(5) | Mineral reserves tonnage, grades and contained metal have been rounded to reflect the accuracy of the estimate, and numbers may not add due to rounding | |
(6) | Has not been generated total sum values. Both products do have not the same saleable and payable elements | |
SRK Consulting (Peru) S. A. | May, 2022 |
SRK Consulting Peru SA SEC Technical Report Summary – El Brocal | Page 148 |
13 | Mining Methods |
Parameters Relevant to Mine Designs and Plans |
El Brocal is a polymetallic deposit with a mantiform geometry located in limestone and volcanic rocks; the ore minerals are chalcopyrite, enargite, argentiferous galena, native silver, among others.
The following zoning can be distinguished in the mineralization (See Figure 13-1 and Figure 13-2):
| ● | TYPE I, corresponding to a copper core: Cu + Au + Ag +/- Bi. |
| ● | TYPE II, corresponding to a transition zone: Cu + Ag + Bi + Zn + Pb. |
| ● | TYPE III, corresponding to a Base Metal zone: Zn + Pb +/- Ag. |
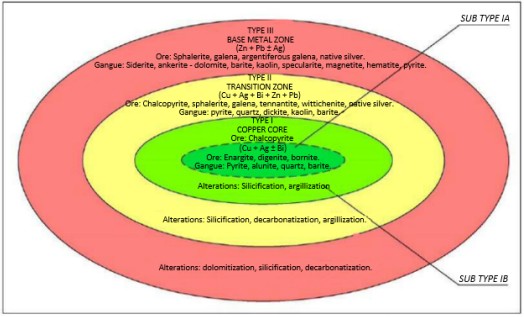
Figure 13-1: El Brocal deposit mineralization zoning
Source: BVN, 2021
El Brocal mining operations are developed at open pit and underground. In turn, these are distributed in the following sectors:
i. | Open pit operations: |
1. | Tajo Norte |
2. | Tajo Sur |
ii. | Underground operations |
1. | Marcapunta Norte |
2. | Marcapunta Centro |
3. | Marcapunta Sureste |
4. | Marcapunta Suroeste |
5. | Marcapunta Sur |
SRK Consulting (Peru) S. A. | May, 2022 |
SRK Consulting Peru SA SEC Technical Report Summary – El Brocal | Page 149 |

Figure 13-2: Distribution of El Brocal mining operations
Source: BVN, 2021
The underground mining methods are Sub Level Stopping with cemented backfill and Room and Pillar with long holes. The pillars left in the ground are chain pillars that run along the entire mining direction and cover the mantle’s extension.
This method varies depending on the mining sector:
SRK Consulting (Peru) S. A. | May, 2022 |
SRK Consulting Peru SA SEC Technical Report Summary – El Brocal | Page 150 |
| ● | North Sector: the stope is 8 m wide, 28 m high, and length varies between 50 to 100 m; the pillar width has been set at 6 m. |
| ● | South Sector, which includes the Southwest and Southeast Zone: the stope is 14 m wide, 28 m high, and the length varies between 50 and 100 m, with a pillar width of 6 m. |
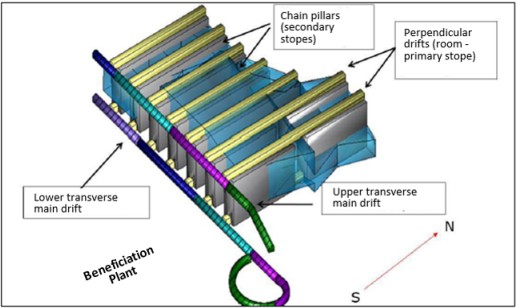
Figure 13-3: Underground mining scheme in El Brocal
Source: BVN, 2021.
The following design parameters have been considered for the open pit operation:
| ● | Bench height: 6 m. |
| ● | Berm width: variable between 5 and 8 m. |
| ● | Ramp width: considering equipment width, safety distances, and safety berm, the open pit have ramp widths of 12 m with a 10% slope. |
| ● | Optimum turning radius according to the equipment fleet is 6.4 m. |
| ● | Minimum loading width considering the excavator and the minimum spaces to carry out operational activities is 20 m. However, one excavator is expected to work with two trucks. As such, the estimated width can be up to 60 m. |
Buenaventura has reported the Ore Reserves for El Brocal on the December 2021 in accordance with U.S Securities and Exchange Commission (SEC) Sk-1300. Ore reserves were estimated based on Mineral Resources (measure and indicated). Table 13-1 shows the Cu-Ag ore reserves report by mining sector, Table 13-2 shows the Pb-Zn ore reserves report by mining sector.
Table 13-1: El Brocal Cu-Ag ore reserves report
Sector | Ore reserves category | Ore | Cu | Ag | Au | As |
Tajo – Norte - Sur | Proven | 2.29 | 2.35 | 3.10 | 0.01 | 0.21 |
Probable | 24.06 | 1.64 | 0.50 | 0.24 | 0.43 | |
Marcapunta Underground | Proven | 0.03 | 1.18 | 1.01 | 0.69 | 0.38 |
Probable | 32.45 | 1.32 | 0.72 | 0.77 | 0.46 | |
Ore reserves total | 58.83 | 1.49 | 0.72 | 0.52 | 0.44 | |
SRK Consulting (Peru) S. A. | May, 2022 |
SRK Consulting Peru SA SEC Technical Report Summary – El Brocal | Page 151 |
Source: BVN, December 2021.
Table 13-2: El Brocal Pb-Zn ore reserves report
Sector | Ore reserves category | Ore | Pb | Zn | Ag |
|---|---|---|---|---|---|
Tajo – Norte - Sur | Proven | 4.79 | 1.37 | 2.65 | 2.94 |
Probable | 3.42 | 0.70 | 1.44 | 2.96 | |
Ore reserves total | 8.21 | 1.09 | 2.15 | 2.95 | |
Source: BVN, December 2021.
El Brocal has a 18,000 tonnes per day (tpd) ore production target for the period 2022 to 2032 distributed in:
| ● | Underground mining production: 8,500 tpd (2022 – 2032). |
| ● | Open pit mining production: 9,500 tpd (2022 – 2032). |
There are zones that restrict the scope of the open pit operation, the archaeological zone (southern open pit) and the Colquijirca town (northern open pit).
Geotechnical |
A) | Open Pit |
The recommendations for inter-ramp angles (IRA) presented in Figure 13-10 were developed by SRK in 2021 and detailed in the document "El Brocal Pit Slope Design - Preliminary Results". The design criteria used for IRA recommendations is a minimum Factor of Safety (FOS) of 1.4 for global slopes and 1.3 for inter-ramp slopes in static conditions, while for pseudo-static conditions, a minimum of 1 was considered for global slope FOS. The probability of failure at bench level considered was <30% for 6 m high benches and the berm width was calculated using the Ritchie criterion. The probability of failure at bench level was determined with a kinematic analysis and the FOS for global slopes was based on a two-dimensional limit equilibrium analysis. The recommended IRAs constitute the maximum achievable angles to meet all design criteria.
Additionally, to evaluate the influence of existing underground excavations with the design of the overlying open pit, a three-dimensional model was built in RS3 where the annual open pit excavation was simulated to determine the vertical displacements in slopes considering the underground workings without backfill. Stability was evaluated using the stress reduction method in the south wall of the open pit with a section in RS2. A FOS of 1.3 in static condition was considered as acceptable for the global slope.
The information reviewed includes the following:
| ● | Structural and geomechanical logging of 6 oriented holes drilled in 2021; RamPeru S. A. C.; 2021. |
| ● | Optical and acoustic televiewer performed on 6 diamond drill holes in 2021; RamPeru S. A. C.; 2021 |
| ● | Geomechanical logging and mapping - Report "Slope Stability Study of Tajo Norte-Smelter-Marcapunta"; DCR Ingenieros S.R.Ltda.; 2016. |
| ● | "Geomechanical mapping of the west slope of Colquijirca pit"; DCR Ingenieros S.R.Ltda.; 2020. |
| ● | Geomechanical logging of underground holes, RamPeru S. A. C.; 2019 and 2020. |
| ● | Geomechanical relogging and mapping field work; DCR Ingenieros S.R.Ltda.; 2020. |
SRK Consulting (Peru) S. A. | May, 2022 |
SRK Consulting Peru SA SEC Technical Report Summary – El Brocal | Page 152 |
● Geological mapping plans (CAD format: Lvl 3912, 3942, 3960, 3960, 3972, 3986, and 4172); Compañia de Minas Buenaventura; 2020.
● Interpreted water table - current condition (Superficie Condición Dic2020.dxf); AMPHOS 21 Consulting Perú S.A.C.; 2021
● El Brocal 2021 lithological and structural model; Compañia de Minas Buenaventura; 2021
● Open pit design; Compañia de Minas Buenaventura; 2020
● 3D topographic model of underground excavations; Compañia de Minas Buenaventura; 2020
● Historical laboratory tests performed for geomechanical reports; Various authors; 2008-2021. Rock mechanics tests are summarized as follows:
| o | 22 tests for physical property determination |
| o | 30 uniaxial compression tests |
| o | 23 indirect tensile tests |
| o | 61 triaxial compression tests |
| o | 25 direct shear tests |
Rock mass characterization
The 2021 lithological model was used as the basis for the characterization of rock mass in the open pit to define the limits and changes in the mechanical behavior of materials found in the open pit. See Figure 13-4.

Figure 13-4: Lithological model 2021 projected in the design of the El Brocal open pit.
Source: BVN
The materials characterized for stability analysis are:
SRK Consulting (Peru) S. A. | May, 2022 |
SRK Consulting Peru SA SEC Technical Report Summary – El Brocal | Page 153 |
| ● | In-situ soil |
| ● | Backfill material: Made up of old dumps in the area of influence of the open pit. |
| ● | Soft rock: Made up of rocks with an RQD less than 25 and which are close to the surface. It is identified in the lithological model as upper Calera. |
| ● | Middle Calera (varved): It lies on the boundary between a rock mass and a soft material. It is considered to have a GSI of 35 for stability analysis. |
| ● | Middle Calera (favorable) |
| ● | Lower Calera |
| ● | Transitional conglomerate |
| ● | Shuco conglomerate |
| ● | Mitu |
| ● | Pyroclastic deposit |
| ● | Porphyritic deposit |
The properties of the materials used in the analyses were calculated from a combination of laboratory tests and statistical analysis of results from geotechnical logging and surface and underground window mapping. For soft materials - in-situ soil, backfill material, and soft rock - the properties calculated from the report "Update of the Stability Study of Condorcayán DME, Tajo Norte", SRK, 2020, were used. For the other materials, the Hoek and Brown's nonlinear criterion was used. The summary of properties can be found in Table 13-3 and Table 13-4.
Table 13-3: Summary of soft material properties
Material | Density (kg/m³) | Cohesion (kPa) | Friction angle (°) |
Soft rock (upper Calera) | 2400 | 103 | 22 |
In-situ soil | 2100 | 5 | 25 |
Faults | 2400 | 2 | 18 |
Source: BVN

Figure 13-5: Nonlinear failure envelope for backfill material
Source: BVN
SRK Consulting (Peru) S. A. | May, 2022 |
SRK Consulting Peru SA SEC Technical Report Summary – El Brocal | Page 154 |
Table 13-4: Summary of rock mass properties
Lithology 2021 | Density (g/cm³) | GSI | mb | s | a | Erm (Gpa) |
|---|---|---|---|---|---|---|
00_Porphyritic dacite | 2.49 | 50 | 0.922 | 0.0039 | 0.506 | 3.3 |
00_Pyroclastic deposit | 2.34 | 47 | 1.145 | 0.0028 | 0.507 | 2.0 |
00_Breccia | 3.41 | 47 | 1.506 | 0.0028 | 0.507 | 13.7 |
20_Middle Calera(var) | 2.57 | 35 | 0.864 | 0.0007 | 0.516 | 2.5 |
30_Middle Calera(fav) | 2.77 | 42 | 1.310 | 0.0015 | 0.510 | 3.9 |
40_Lower Calera | 2.24 | 47 | 3.766 | 0.0028 | 0.507 | 3.2 |
50_Transitional conglomerate | 2.29 | 51 | 1.147 | 0.0043 | 0.505 | 7.9 |
60_Shuco conglomerate | 2.38 | 53 | 3.919 | 0.0054 | 0.505 | 1.9 |
70_Mitu (*) | 2.50 | 51 | 2.954 | 0.0043 | 0.505 | 4.1 |
Source: BVN
The shear strength of a rock mass is weaker along discontinuities or bedding planes, which are notorious in a sedimentary deposit like El Brocal. The direction of preferred planes of weakness is defined by the layering in sedimentary units (Calera units, Conglomerates, and Mitu) while in the igneous units (porphyritic dacite, pyroclastic deposit, and breccias) the anisotropy is defined by the predominant families of discontinuities. Anisotropic models in six structural domains were used in the slope stability analyses (See Figure 13-7).
The main geological structures (Figure 13-6) identified in the project area are:
| ● | East-dipping bedding |
| ● | North-South oriented faults (Huarau Faults) |
| ● | East-West oriented faults (Smelter, Centro, and Marcapunta Faults) |

Figure 13-6: Main faults in the El Brocal structural model
Source: BVN
SRK Consulting (Peru) S. A. | May, 2022 |
SRK Consulting Peru SA SEC Technical Report Summary – El Brocal | Page 155 |

Figure 13-7: Definition of structural domains in the El Brocal pit
Source: BVN
The families of discontinuities defined for each structural domain were used for the kinematic analysis where wedge, planar, and toppling failures were identified. The spatial variability of each discontinuity family in dip and dip direction was considered for the calculation of cumulative failure probability for different bench angles in the six structural domains and the six delimited design sectors. Bench angles between 60° to 75° were obtained as a result.
Design sectors were delimited considering lithological changes, pit wall orientation, and location of major faults. For the pre-feasibility level analyzed, 5 associated sections were constructed for each design sector. The outcropping of Bajo fault in sectors S4 and S7 may result in a large-scale planar instability as it has the same dip direction as the designed slopes; this geometric configuration is analyzed in the limit equilibrium sections S4 and S7.
SRK Consulting (Peru) S. A. | May, 2022 |
SRK Consulting Peru SA SEC Technical Report Summary – El Brocal | Page 156 |

Figure 13-8: Design sectors for stability analysis of El Brocal pit
Source: BVN
The limit equilibrium analysis was developed in Slide, one section for each design sector shown in Figure 13-8. As of December 2020, an inferred water table was used without considering the excavation from open pit to end wall. The depressurization of design sectors S2 and S4 is important in order to avoid water contact with the Bajo fault backfill material which would cause a reduction in the mechanical properties of the structure outcropping on the walls of sectors S2, S3, and S4. To achieve the minimum FOS of 1.4 in sectors S2 and S4, the open pit bottom elevation has been raised to avoid fault outcrop on the pit wall. The geometry of Bajo fault and the characteristics of the backfill material should be confirmed at the feasibility stage.

Figure 13-9: Example of stability analysis. Section S2 for the sector of the same name
Source: BVN
SRK Consulting (Peru) S. A. | May, 2022 |
SRK Consulting Peru SA SEC Technical Report Summary – El Brocal | Page 157 |
For each design sector, geometric configurations are recommended depending on the limits between soft materials (in-situ soil, backfill material, and upper Calera) with decouplings of 12 meters at each change of material and a slope angle of 2H:1V in soft materials. Bench height is 6 meters with maximum inter-ramp height of 60 meters and elevated pit bottom for design sectors S4 and S7 (4085 and 4127 MASL respectively).
Figure 13-10 shows the design recommendations for six sectors delineated for the 2020 open pit design.

Figure 13-10: Design recommendations for open pit design 2020
Source: BVN
Geotechnical risks in the El Brocal open pit
The geotechnical design of the El Brocal open pit presented in this report considers the stability analysis for the final walls at the end of the pit’s life of mine. The stability of the intermediate or operative slopes should be continuously verified by the Mine Planning Department of the El Brocal as the mining progresses and it should incorporate the new geotechnical information collected during the excavation and exposition of the new pit walls.
Historically the El Brocal open pit has had wall instability issues in its West wall because, the orientation of the stratification has an unfavourable dip for the overall stability. This structural condition together with the presence of siltstones and the increase of the water table during the raining season (December to March) are unfavourable for the slope stability. SRK recommends
SRK Consulting (Peru) S. A. | May, 2022 |
SRK Consulting Peru SA SEC Technical Report Summary – El Brocal | Page 158 |
the evaluation of the phases stability in a tridimensional model that could incorporate the changes in the walls orientation and use a real time deformation monitoring system (like radars) during the mining of the open pit. The monitoring system should be under the supervision of the Geomechanics team in the mine, so it can alert and evacuate all the operative personnel if a major slope failure occurs.
In the South-East wall of the existing tajo Norte, it is located an old waste dump deposit called the “botadero Sur”. This waste dump is located very close to the pit crest and will influence in the global stability of the SE wall as the open pit mining goes South. The South waste dump could act as a water collector that would affect the underlaying pit wall, to prevent that SRK recommends to push the waste dump South, away from the designed pit crest prior to the mine in that wall so the risk of an slope failure due to the interaction of the waste dump and open pit is reduced significantly.
The underground workings that will interact with the open pit will not represent a global geotechnical stability risk, but the voids should be considered in the local stability analysis. It is highly likely that the old underground workings will have an impact in the open pit wall stability during the pit mining if the underground openings are not well handled. SRK recommends stablishing a void management plan that describes in detail the procedures to follow for the early detection and dealing with voids when they intersect the open pit.
B) | Pit - underground mine interaction analysis |
To analyze the interaction between the underground mine and the open pit, a three-dimensional model in RS3 was used to simulate the annual mining sequence of the open pit until 2034. This assessment considered that the underground openings would have no backfill during the years of open pit mining.
Figure 13-11 shows the impact on the open pit walls as mining progresses southward and approaches the underground excavations. By 2034, a zone of increased displacement (> 0.20m) is evident towards the center of the pit and another on the south wall of the open pit. To determine if the voids produced by the underground mine have an effect on the south wall stability, Section 6 was analyzed in RS2, and stress reduction was used to determine the FOS. A SRF of 1.71 was obtained showing that the wall is stable once the voids are filled. See Figure 13-12.
SRK Consulting (Peru) S. A. | May, 2022 |
SRK Consulting Peru SA SEC Technical Report Summary – El Brocal | Page 159 |

Figure 13-11: Simulation of open pit mining to identify critical sectors
Source: BVN

Figure 13-12: Section 6 - maximum shear isocontours under static conditions
Source: BVN
SRK Consulting (Peru) S. A. | May, 2022 |
SRK Consulting Peru SA SEC Technical Report Summary – El Brocal | Page 160 |
C) | Underground Mine |
El Brocal underground mine is located in the southern projection of the open pit between coordinates N 88009476 to 8806621 (WGS84).

Figure 13-13: Projected 2020 reserves with open pit design
Source: BVN

Figure 13-14: East view of 2020 reserves with open pit projection
Source: BVN
The mining methods to be applied by sector are defined in Table 13-5.
SRK Consulting (Peru) S. A. | May, 2022 |
SRK Consulting Peru SA SEC Technical Report Summary – El Brocal | Page 161 |
Table 13-5: Mining methods by sector
Mining method | North Zone | Central Zone | Southwest Zone | Southeast Zone | Southwest Zone 2 | South Zone |
Room-and-pillar with long holes | | | X | X | | |
Pillar recovery with cemented backfill | X | X | | | | |
Sublevel stopping with cemented backfill, with mining of primary and secondary stopes | | | | | X | X |
Source: BVN, 2021
Geotechnical database
Information reviewed for the underground mine geotechnical database includes the following:
| ● | Structural and geomechanical logging of 1 oriented hole drilled in 2021; RamPeru S. A. C.; 2021. |
| ● | Optical and acoustic televiewer performed on 6 diamond drill holes in 2021; RamPeru S. A. C.; 2021 |
| ● | Geomechanical logging and mapping - Report "Geomechanical Evaluation Report of the Marcapunta N, SW, and SE Underground Mining"; DCR Ingenieros S.R.Ltda.; 2017. |
| ● | Geomechanical logging of underground holes, RamPeru S. A. C.; 2019 and 2020. |
| ● | Geomechanical relogging and mapping field work; DCR Ingenieros S.R.Ltda.; 2020. |
| ● | Geological mapping plans (CAD format: Lvl 3912, 3942, 3960, 3960, 3972, 3986, and 4172); Compañia de Minas Buenaventura; 2020. |
| ● | El Brocal 2021 lithological and structural model; Compañia de Minas Buenaventura; 2021 |
| ● | 2020 Resources and Reserves Model; Compañia de Minas Buenaventura; 2020 |
| ● | 3D topographic model of underground excavations; Compañia de Minas Buenaventura; 2020 |
| ● | Historical laboratory tests performed for geomechanical reports; Various authors; 2008-2021. Rock mechanics tests for all reserve zones are summarized as: |
| o | 15 tests for physical property determination |
| o | 10 uniaxial compression tests |
| o | 9 indirect tensile tests |
| o | 13 triaxial compression tests |
| o | 13 direct shear tests |
Geomechanical characterization of rock mass
Underground mine characterization was divided based on geotechnical, geological, and geometrical information of the mineralized structure. The underground mine has been divided into five sectors for rock quality analysis, as shown in Figure 13-15.
SRK Consulting (Peru) S. A. | May, 2022 |
SRK Consulting Peru SA SEC Technical Report Summary – El Brocal | Page 162 |
Table 13-6: RMR'76 statistics by geotechnical sectors, is divided into geotechnical sectors which in turn were subdivided based on the spatial location of the drill hole or mapping with respect to the mineralized structure. The zones identified are intermediate wall (IW), footwall (FW), close footwall (CFW), hanging wall (HW), close hanging wall (CHW), and orebody (ORE). The close hanging wall and footwall were considered for a distance of +/- 15 meters from the mineralization.
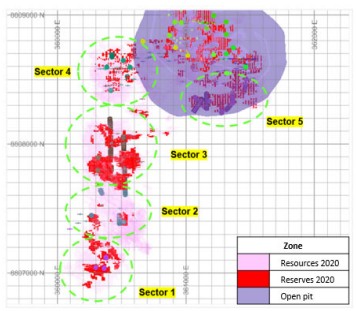
Figure 13-15: Geotechnical analysis sectors
Source: BVN
Table 13-6: RMR’76 statistics by geotechnical sectors.
Sector | Zone | No. of samples | Minimum | Maximum | Est. Dev. | Average |
1 | FW | 88 | 17 | 79 | 16.6 | 46.2 |
1 | CFW | 18 | 20 | 60 | 17.0 | 46 |
1 | HW | 66 | 23 | 68 | 9.9 | 48.3 |
1 | CHW | 10 | 21 | 63 | 10.6 | 53.3 |
1 | ORE | 37 | 17 | 65 | 10.6 | 50 |
2 | FW | 87 | 20 | 73 | 11.1 | 54.9 |
2 | CFW | 57 | 19 | 68 | 11.8 | 50.8 |
2 | HW | 159 | 22 | 74 | 13 | 52.7 |
2 | CHW | 25 | 33 | 75 | 8.7 | 56.9 |
2 | ORE | 158 | 19 | 75 | 12.1 | 54.5 |
3 | IW | 31 | 31 | 74 | 9.4 | 52.5 |
3 | FW | 409 | 21 | 73 | 11.3 | 54.2 |
3 | CFW | 81 | 26 | 73 | 10.8 | 53.3 |
3 | HW | 287 | 21 | 72 | 14.2 | 49.8 |
3 | CHW | 58 | 22 | 72 | 11.5 | 52.8 |
3 | ORE | 280 | 22 | 77 | 10.1 | 55.8 |
4 | IW | 9 | 58 | 72 | 4.1 | 63.3 |
4 | FW | 185 | 31 | 79 | 8.0 | 61.3 |
4 | CFW | 89 | 24 | 76 | 15.9 | 51.9 |
4 | HW | 383 | 17 | 74 | 13.2 | 49.7 |
4 | CHW | 48 | 37 | 76 | 8.4 | 61.6 |
4 | ORE | 176 | 33 | 75 | 7.8 | 59.4 |
5 | IW | 40 | 49 | 73 | 6.6 | 63.2 |
5 | FW | 288 | 28 | 77 | 7.4 | 63.6 |
5 | CFW | 107 | 29 | 75 | 11.8 | 56.9 |
SRK Consulting (Peru) S. A. | May, 2022 |
SRK Consulting Peru SA SEC Technical Report Summary – El Brocal | Page 163 |
Sector | Zone | No. of samples | Minimum | Maximum | Est. Dev. | Average |
5 | HW | 440 | 16 | 77 | 12.9 | 57.5 |
5 | CHW | 110 | 16 | 72 | 12.2 | 57.8 |
5 | ORE | 405 | 26 | 77 | 8.1 | 61.5 |
Source: BVN
Structural domains
El Brocal mine has been divided into seven structural domains delimited by major faults (information provided by BVN). See Figure 13-16 These domains encompass both the surface and underground mine.
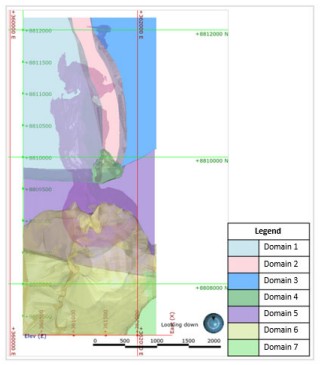
Figure 13-16: Structural domains defined for the El Brocal mine
Source: BVN
The predominant domains where 2020 reserves are located are domains 1, 5, 6, and 7; reserves in domain 1 are generally associated with the recovery of pillars in old workings.
Major structures have a predominant NS and EW strike as shown in Figure 13-17, and minor structures follow that regional trend.
SRK Consulting (Peru) S. A. | May, 2022 |
SRK Consulting Peru SA SEC Technical Report Summary – El Brocal | Page 164 |
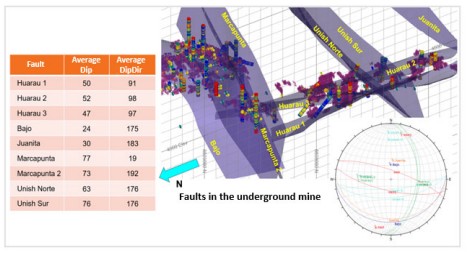
Figure 13-17: Major faults in the underground mine
Source: BVN
Geomechanical condition of the El Brocal underground mine
Currently, El Brocal mine uses the long-hole Sub Level Stopping mining method and detrital fill in the most unfavorable sectors. Additionally, the height of overburden varies from 80 to 400 m depth. In the past, some sectors, located in the northeast sector of the mine, have been mined using the conventional room and pillar method. The following figure shows the current situation of El Brocal mine.
SRK Consulting (Peru) S. A. | May, 2022 |
SRK Consulting Peru SA SEC Technical Report Summary – El Brocal | Page 165 |
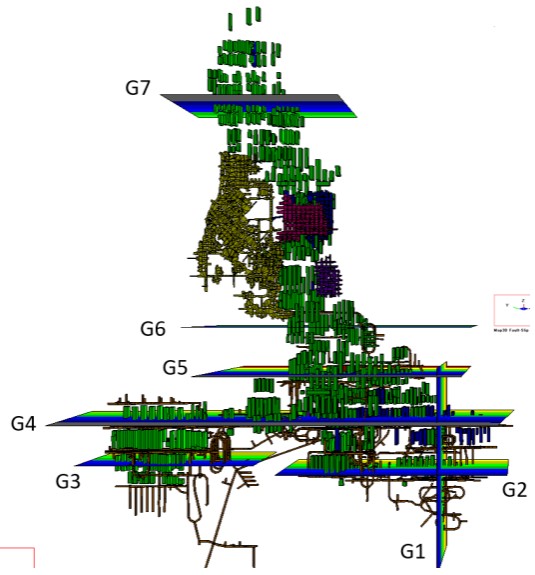
Figure -13-18: Plan view of El Brocal mine’s current mining area
Source: BVN
Stress analysis in the current mining area shows low induced stress magnitudes and evidence of significant relaxation zones due to underground mining.
Section G3, located in the southwest area of the mine, shows that stress s1 levels in rib pillars are in the order of 8 to 10 MPa and for stress s3 in the range of <0 Mpa. Also, stress levels in the stopes dome are between 0 and 2 Mpa for stress s1 and between 0 and 1 Mpa for stress s3.
Section G2, located in the southeast sector in the deepest zone of the mine, shows that stress s1 levels in the rib pillars are between 12 and 16 Mpa and stress s3 is in the range of <0 Mpa. Stress levels in the stopes dome are in the order of 0 to 2 Mpa for stress s1 and 0 to 1 Mpa for stress s3.
Section G5, located south of the current mining zone, shows that s1 stress levels in rib pillars are in the order of 8 to 12 Mpa and for stress s3 in the range of <0 Mpa. Also, the stress levels in the stopes dome are between 0 and 2 Mpa for stress s1 and for stress s3 they are in the order of <0 Mpa.
SRK Consulting (Peru) S. A. | May, 2022 |
SRK Consulting Peru SA SEC Technical Report Summary – El Brocal | Page 166 |
Finally, section 7, located to the north of the mine, shows that stress s1 levels in rib pillars are in the range of 4 to 8 Mpa and for stress s3 is in the range of <0 Mpa. Also, stress levels in the stopes dome are between 0 and 2 Mpa for stress s1 and for stress s3 they are in the order of <0 Mpa.
The comparison of stresses in rib pillars shows that most of the pillars are stable for the rock mass quality with GSI values of 50 to 65 (IIIa and II type rocks). Stress s3 values are close to 0, which would suggest that they are at the tensile limit and could cause the pillar to relax, so a shotcrete layer is applied when pillars are adjacent to access roads.

Figure 13-19: Rib pillar stresses vs. rock type failure criteria
Source: BVN
The stability of mining stopes was also verified through a retro analysis using the graphical stability method to compare the results of scanner topography vs. the mining design. ELOS values in the order of 0.2 to 0.5 m in the most unfavorable walls with N-S direction of the mining stopes were obtained. The following figure shows the ELOS values in two stopes verified in the southern zone of the El Brocal mine.

Figure 13-20: Stability retro-analysis of El Brocal south area mining stopes
Source: BVN
Based on the assessments performed and on the history of subsidence in the northern area of El Brocal underground mine, we can deduce that backfilling, as applied, contributes significantly to
SRK Consulting (Peru) S. A. | May, 2022 |
SRK Consulting Peru SA SEC Technical Report Summary – El Brocal | Page 167 |
stability control. Additionally, the pillars and mining stopes are stable and benefit from the quality of the mass rock (Type II and III rock) and the predominant structural conditions.
Geomechanical design of mining methods
El Brocal has decided to use the long-hole room and pillar mining method in the southeast and southwest zones adjacent to the current mining zone. A pillar recovery method with cemented backfill will be used throughout the current mining zone while a sublevel stopping method, with cemented backfill through the mining of primary and secondary stopes, will be used in the southern zone of the mine.
The geomechanical design parameters for each of the mining methods are summarized below.
Long-hole room-and-pillar mining design
Mining area using the long-hole room and pillar method to be applied in geotechnical sectors 4 and 5, where the existing sublevel heights vary from 22.5 to 30 m from floor to roof and with sublevels with an approximate section of 4.5 x 4.5 m.
Mining direction of stopes in both sectors are N-S and the mining scenarios identified are as follows:
● Longitudinal extension of rooms from north to south of a single sublevel.
● Mining of a second sublevel of the rooms.
● Partial recovery of rib pillars.
Table 13-7 and Table 13-8 show the maximum longitudinal room dimensions for different existing sublevel heights and predominant rock quality, considering an equivalent linear overbreak/slough (ELOS) of 0.5 m and predominant rock quality ranges from RMR 50 to 60 (Fair rock type IIIa) and RMR >60 (Good rock type II).
Table 13-7: Dimension of stopes for ELOS=0.5 m and RMR > 60 (II)
Sector | Sublevel | Pit length (m) | Maximum width (m) | Mining Direction |
|---|---|---|---|---|
4 | 22.5 | 80 | 8 | N-S |
4 | 24.5 | 80 | 8 | N-S |
4 | 28.5 | 57 | 8 | N-S |
4 | 34.5 | 42 | 8 | N-S |
5 | 22.5 | 77 | 8 | N-S |
5 | 24.5 | 60 | 8 | N-S |
5 | 26.5 | 51 | 8 | N-S |
5 | 30 | 41 | 8 | N-S |
Source: BVN
SRK Consulting (Peru) S. A. | May, 2022 |
SRK Consulting Peru SA SEC Technical Report Summary – El Brocal | Page 168 |
Table 13-8: Dimension of stopes for ELOS=0.5 m and RMR 50-60 (IIIa)
Sector | Sublevel height (m) | Pit length (m) | Maximum width (m) | Mining Direction |
|---|---|---|---|---|
4 | 22.5 | 22 | 8 | N-S |
4 | 24.5 | 20 | 8 | N-S |
4 | 28.5 | 18 | 8 | N-S |
4 | 34.5 | 16 | 8 | N-S |
5 | 22.5 | 17 | 8 | N-S |
5 | 24.5 | 16 | 8 | N-S |
5 | 26.5 | 15 | 8 | N-S |
5 | 30 | 14 | 8 | N-S |
Source: BVN
The maximum span sizing in the roof of rooms of mining stopes in the Southwest sector - Geotechnical sector 4 and Southeast sector - Geotechnical sector 5, were carried out according to the criteria of Rimas Pakalnis and Wang (2000), considering the predominant RMR of each zone. The following table shows the values of maximum span or width at the stopes dome based on the predominant rock quality of each zone.
Table 13-9: Maximum span (m) for stopes dome
Sector | Predominant Design RMR | Stable maximum width or span (m) | Potentially unstable maximum width or span (m) |
|---|---|---|---|
4 | 55 | 7 | 16 |
4 | 60 | 9 | 19 |
4 | 65 | 12 | 23 |
5 | 60 | 9 | 19 |
5 | 65 | 12 | 23 |
5 | 70 | 15 | 26 |
Source: BVN
Considerations for the control of pillar stability in mining stopes
Considering that most of the existing pillar widths are in the order of 5 to 6.5 m and in some sectors have widths of 9 to 15 m, it was estimated that the stability level of narrow pillars (5 to 6.5 m) is currently critical and backfill will need to be used to guarantee their stability in future mining works.
An extension of the existing rooms in N-S strike will require the use of backfill (detrital or cemented) to maintain the recommended maximum hydraulic radius.
For the mining of a second sublevel, the first sublevel is required to be completely backfilled to confine the lower pillar, which may be cemented or uncemented.
Considerations for the support of mining stopes
In the southwest and southeast mining sectors, where the long-hole room and pillar method will be applied, the use of bolting cable support will be required in the stopes dome considering that the
SRK Consulting (Peru) S. A. | May, 2022 |
SRK Consulting Peru SA SEC Technical Report Summary – El Brocal | Page 169 |
sublevels are expanded until reaching the mining stope width (8 m) and specifically in the areas with unfavorable rock quality (RMR < 60). Here we recommend implementing a standard of support for sublevels extended to stope width.
Sectors where partial pillar recovery is required due to unfavorable rock quality conditions, the roof may require reinforcement to ensure stability control. Additionally, the maximum potentially unstable width or span in the dome of pillar recovery zones should be controlled.

Figure 13-21: Typical support section in the long-hole room and pillar method
Source: BVN
Pillar recovery with cemented backfill
The pillar recovery mining area in the North and Central sector of the current mining area and below the projected open pit has sublevel heights between 12 to 22 m from floor to floor and sublevels with an approximate section of 4.5 x 4.5 m, where a N-S stope mining direction was applied.
The cemented backfill of primary stopes, prior to pillar recovery, was considered. Also, it will be important to ensure the topping off of backfill towards the dome or the construction of artificial shotcrete pillars to prevent the collapse of the roof or dome during pillar recovery.
The pillar cannot be mined in areas where primary stopes are already backfilled with detrital fill.
SRK Consulting (Peru) S. A. | May, 2022 |
SRK Consulting Peru SA SEC Technical Report Summary – El Brocal | Page 170 |
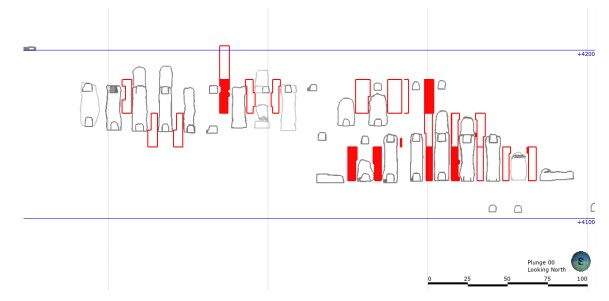
Figure 13-22: Profile view looking north of the north mining sector.
Source: BVN
Support of mining stopes with pillar recovery and cemented backfill
The cemented backfill of primary stopes should guarantee topping so as not to generate a span exceeding the rock mass capacity. Some artificial pillar construction options should be evaluated if necessary.
Drilling sublevels should be constructed and located without disturbing the stability of the pillar to be recovered.
A temporary pillar is required to be left in the left wall of the lower drilling sublevels to prevent the pillar from collapsing under its own weight. Figure 13-23 below shows a typical scheme for pillar recovery.
Figure 13-23: Typical mining section for rib pillar recovery with cemented backfill.
Source: BVN
SRK Consulting (Peru) S. A. | May, 2022 |
SRK Consulting Peru SA SEC Technical Report Summary – El Brocal | Page 171 |
Design of sublevel stoping with cemented backfill by mining primary and secondary stopes
Mining stopes dimensions for Southwest 2 and South sector - Geotechnical sector 1, 2 and 3, using the method of sublevel stoping with cemented backfill, by mining primary and secondary stopes with the mining direction and length of the most unfavorable stope wall of N-S; assuming different sublevel heights of 18 to 30 m from floor to floor and an equivalent linear overbreak/slough (ELOS) of 0.5 m.
Dimensions may be applied according to the predominant RMR of each design sector.
| ● | For Design Sector 1, the predominant RMR is between 30 and 70. |
| ● | For Design Sector 2, the predominant RMR is between 50 and 70. RMR ranges from 40 to 50 in lesser incidence. |
| ● | For Design Sector 3, the predominant RMR is between 50 and 70. RMR ranges from 40 to 50 in lesser incidence. |
Table 13-10: Dimension of stopes for ELOS=0.5 m, RMR > 60 (II)
Sector | Sublevel height (m) | Pit length (m) | Maximum width (m) | Mining Direction |
|---|---|---|---|---|
1, 2, and 3 | 18 | 80 | 8 | N-S |
1, 2, and 3 | 20 | 80 | 8 | N-S |
1, 2, and 3 | 25 | 64 | 8 | N-S |
1, 2, and 3 | 30 | 45 | 8 | N-S |
Source: BVN
Table 13-11: Dimension of stopes for an ELOS=0.5 m, RMR 50 to 60 (IIIa)
Sector | Sublevel height (m) | Pit length (m) | Maximum width (m) | Mining Direction |
|---|---|---|---|---|
1, 2, and 3 | 15 | 41 | 8 | N-S |
1, 2, and 3 | 18 | 28 | 8 | N-S |
1, 2, and 3 | 20 | 24 | 8 | N-S |
1, 2, and 3 | 25 | 20 | 8 | N-S |
1, 2, and 3 | 30 | 17 | 8 | N-S |
Source: BVN
Table 13-12: Dimension of stopes for an ELOS=0.5 m, RMR 40 to 50 (IIIb)
Sector | Sublevel height (m) | Pit length (m) | Maximum width (m) | Mining Direction |
1, 2, and 3 | 15 | 12 | 8 | N-S |
1, 2, and 3 | 18 | 11 | 8 | N-S |
1, 2, and 3 | 20 | 10 | 8 | N-S |
1, 2, and 3 | 25 | 9 | 8 | N-S |
1, 2, and 3 | 30 | 9 | 8 | N-S |
Source: BVN
SRK Consulting (Peru) S. A. | May, 2022 |
SRK Consulting Peru SA SEC Technical Report Summary – El Brocal | Page 172 |
Table 13-13: Dimension of stopes for an ELOS=0.5 m, RMR 30 to 40 (IVa)
Sector | Sublevel height (m) | Pit length (m) | Maximum width (m) | Mining Direction |
|---|---|---|---|---|
1, 2, and 3 | 15 | 10 | 8 | N-S |
1, 2, and 3 | 18 | 9 | 8 | N-S |
1, 2, and 3 | 20 | 9 | 8 | N-S |
1, 2, and 3 | 25 | 8 | 8 | N-S |
1, 2, and 3 | 30 | 8 | 8 | N-S |
Source: BVN
Support of mining stopes in design sectors 1, 2, and 3
In the South and Southwest 2 mining sectors, where design sectors 1, 2, and 3 are located, and where the sublevel stoping method with cemented backfill will be applied through the mining of primary and secondary stopes, the use of bolting cable support will be required in the dome of primary and secondary stopes, mainly where rock quality is unfavorable.
Anchor lengths will be established based on stope width and rock mass quality.
Figure 13-24 shows a typical scheme of support installation in the stopes dome or roof.

Figure 13-24: Typical support section in the dome of primary and secondary stopes
Source: BVN
Geotechnical characteristics of cemented mine backfill
Considering sublevel stoping with mining of primary and secondary stopes and rib pillar recovery with cemented backfill, the required backfill strength design has been performed, by applying the
SRK Consulting (Peru) S. A. | May, 2022 |
SRK Consulting Peru SA SEC Technical Report Summary – El Brocal | Page 173 |
analytical criteria of Mitchell (1982), for a factor of safety of 1.5, sublevel heights of 18, 20, and 25 m, and stope lengths that may vary from 20 to 50 m.
If the requested strengths cannot be achieved, the secondary stope mining length can be reduced to reduce the exposure of wall lengths.
The use of detrital or hydraulic backfill is recommended as confinement in the sectors where rib pillar recovery is not planned, or when a second mining level is desired.
Table 13-14: Cemented backfill strength required for underground mining
Vertical stope height (m) | Length of primary stope or exposed backfill wall (m) | Required UCS strength (MPa) |
|---|---|---|
18 | 20 | 0.42 |
20 | 20 | 0.44 |
25 | 20 | 0.47 |
18 | 30 | 0.54 |
20 | 30 | 0.57 |
25 | 30 | 0.62 |
18 | 50 | 0.69 |
20 | 50 | 0.73 |
25 | 50 | 0.83 |
Source: BVN
Hydrogelogical |
The hydrogeological evaluation was carried out to evaluate the groundwater inflow to the North Pit, South Pit and the underground mine deepening according to the mining plan provided by SMEB for the period 2021-2034 and to estimate pore pressures for stability analysis on pit walls. For this, a hydrogeological numerical model was developed using the Feflow 7.0 (DHI-WASY GmbH, 2018) software. The model has been developed based on the conceptual understanding of the sector that was established by integrating hydrological and geological information, gauges, piezometric levels and hydraulic tests.
The geology in the study area is made up of a sequence of sedimentary, volcanic and metamorphic rocks that were instructed by dacite domes and freomagmatic breccias. These sedimentary rocks have been folded into three or more parallel anticlines, following an N-S direction. The Marcapunta Dioritic Stock is associated with regional faults and brought mineralization in the open pit and underground mine sector. On the other hand, as more recent events are the unconsolidated deposits (colluvial, moraines and alluvial) generally located at the bottom of valleys with limited thickness, although in some sectors they present considerable thicknesses of up to 100 m. In general, The main groundwater flow occurs in the first 50 to 100 m depth of the bedrock, where is highly fractured as a result of the folding of the layers associated with different tectonic events, and added to this the longitudinal faults such as They are, Fallas San Cristobal fault, Andacacha fault, Lachipana fault, make these structures facilitate the movement of the underground flow, however at a greater depth the movement of the underground flow would be limited to the permeability of the matrix and few interconnected fractures.
Current pit dewatering system consists of 02 well (12 inch diameter) and 01 collection pond at the bottom. Currently, there is no instrumentation to quantify the flows extracted from the bottom of
SRK Consulting (Peru) S. A. | May, 2022 |
SRK Consulting Peru SA SEC Technical Report Summary – El Brocal | Page 174 |
the pit. However, the total flow is approximately estimated on 60 l/s. The underground mine is located to the south of the pit. Data provided by SMEB indicates drainage flow is between 118 and 200 l/s. This flow is managed through a pumping system inside the labors discharging through Marcapunta Norte entrance.. (See Figure 13-25).

Figure 13-25: Annual average estimates of pit and underground inflow
Source: Amphos
The project includes the expansion of the pit to the south of the mine (southern pit) and the underground expansion to the east and to the southwest. Plans exist to dispose of backfill in the northeast sector of the North pit, which will mean that the current pumping well will be inoperative. This configuration has been simulated with the calibrated hydrogeological models, which generates estimates of the new drainage requirements. The results of these simulations indicate that pit drainage flows will increase slightly to 66 l/s while underground mine drainage will reach maximum of 250 l/s, both cases as annual averages.
Even if no substantial increments are expected in the future, a new pit dewatering system will be necessary in the sector between North Pit and South Pit. This new dewatering system will replace the one that will be destroyed by backfill disposal in the pit. Additionally, given that the underground mine develops to deepest levels, the mine drainage design needs to be updated.
Preliminary, 04 new pumping wells is required in the middle zone (see Figure 13-26). Exactly location and distribution need to be evaluated in Pit Dewatering Evaluation. This evaluation must include pumping tests and at least 08 new piezometer to support the interpretation of tests.
SRK Consulting (Peru) S. A. | May, 2022 |
SRK Consulting Peru SA SEC Technical Report Summary – El Brocal | Page 175 |

Figure 13-26: Proposed pit dewatering sector
Source: Amphos
It is important to point out that the underground mine is in a massif rock with low hydraulic conductivity (permeability) conditions that allow a focused cone depression.
The geochemical behavior of some specific components has been evaluated through the results of two different geochemical campaigns (Golder, 2010 and Amphos 21, 2019). The specific components under evaluation are the current open pit and underground mine (Tajo Norte and Marcapunta Norte, respectively), a future additional open pit mine (Tajo Sur) and the Tajo Norte fill. A total of 81 samples taken from waste rock dumps and exploratory wells were analyzed. However, only some of the tests had other tests in addition to ABA and pulp pH, and only two moisture test cells have been performed, which is clearly not sufficient to evaluate the behavior of the 4 components to be evaluated. Despite the need to strengthen geochemical studies, some conclusions can be drawn from existing results.
The carbonate content of the samples is variable, although many samples have a high carbonate content. This is expected due to the dominant lithologies (limestones and dolomites). This can result in a high neutralization potential for these rocks. Despite this carbonate content, there are
SRK Consulting (Peru) S. A. | May, 2022 |
SRK Consulting Peru SA SEC Technical Report Summary – El Brocal | Page 176 |
some low carbonate, high sulfur lithologies, which can result in short-term acid drainage. Furthermore, rocks with a high neutralization potential could not develop this potential, since the oxidation of sulfides can promote the precipitation of oxides on carbonate surfaces, inhibiting the neutralization of acids. Based on this and available water quality data, it is expected pH values between 4 and 6 with exceedances in some parameters (i.e. iron, copper, manganese, lead and zinc), therefore, treatment is required.
Finally, the number of samples and the tests carried out, although they are sufficient to determine the geochemical behavior in general, would not be totally conclusive to determine the specific behavior in each of the project components. For this reason, it is recommended to reinforce the geochemical studies with complementary samplings that allow reducing the gap of uncertain behavior that some of the results show in the antecedents. These recommendations are associated with a battery of tests that involves, Acid-base Accounting (ABA), Total Rock Chemical Analysis (WRA), Mineralogy, Short-term leaching by shake flask extraction (SFE) and long-term humidity cell leaching (HTC). The number of samples are related with total material to extract and must be evaluated; however, this number could be between 20 and 50 samples.
Production Rates, Expected Mine Life, Mining Unit Dimensions, and Mining Dilution and Recovery Factors |
El Brocal’s open pit (OP) and underground (UG) operations, has as a general production target 18,000 tpd of ore. Based on this, the life of the mine (LOM) has been estimated at 11 years (2022 to 2033).
Open Pit |
Production schedule/phases |
El Brocal’s open pit operations has as a production target 9,500 tpd of ore. Based on this, the LOM has been estimated at 10 years (2022 to 2032) exploiting 26.22 Mt Cu ore (1.67% Cu, 0.71 oz/t Ag y 0.22 g/t Au) and 8.69 Mt Pb/Zn ore (1.06% Pb, 2.13% Zn y 2.85 oz/t Ag). See Table 13-15 and Table 13-16.
SRK Consulting (Peru) S. A. | May, 2022 |
SRK Consulting Peru SA SEC Technical Report Summary – El Brocal | Page 177 |
Table 13-15: Tajo Sur (Cu-Ag ore) open pit mining plan
Description | 2022 | 2023 | 2024 | 2025 | 2026 | 2027 | 2028 | 2029 | 2030 | 2031 | 2032 | Total |
OP treated Cu ore (Mt) | 0.47 | 0.51 | 1.28 | 2.23 | 3.34 | 3.34 | 3.34 | 3.34 | 3.34 | 2.93 | 2.23 | 26.38 |
Cu (%) | 1.71 | 2.37 | 2.63 | 1.67 | 1.63 | 1.69 | 1.74 | 1.77 | 1.39 | 1.57 | 1.64 | 1.70 |
Ag (oz/t) | 2.31 | 2.84 | 2.97 | 1.69 | 0.43 | 0.73 | 0.37 | 0.33 | 0.24 | 0.37 | 0.43 | 0.73 |
Au (g/t) | 0.01 | 0.01 | 0.01 | 0.06 | 0.21 | 0.09 | 0.38 | 0.35 | 0.28 | 0.23 | 0.25 | 0.22 |
As (%) | 0.12 | 0.12 | 0.23 | 0.31 | 0.47 | 0.40 | 0.53 | 0.52 | 0.34 | 0.41 | 0.44 | 0.41 |
Fe (%) | 8.08 | 8.94 | 10.83 | 12.16 | 12.25 | 11.14 | 11.43 | 8.25 | 10.13 | 10.95 | 11.88 | 10.84 |
Cu recovery (%) | 70.0 | 83.0 | 84.0 | 70.0 | 70.0 | 70.0 | 70.0 | 70.0 | 65.0 | 66.0 | 67.0 | 70.2 |
Ag recovery (%) | 55.0 | 56.0 | 57.0 | 50.0 | 40.0 | 45.0 | 40.0 | 40.0 | 30.0 | 40.0 | 40.0 | 47.6 |
Au recovery (%) | 20.0 | 20.0 | 20.0 | 20.0 | 22.0 | 22.0 | 24.0 | 24.0 | 24.0 | 24.0 | 24.0 | 23.5 |
As recovery (%) | 65.0 | 65.0 | 65.0 | 65.0 | 73.0 | 73.0 | 73.0 | 73.0 | 68.0 | 69.0 | 70.0 | 71.0 |
Cu recovered fines (kt) | 5.6 | 10.0 | 28.3 | 26.1 | 38.2 | 39.6 | 40.7 | 41.4 | 30.2 | 30.3 | 24.6 | 315.1 |
Ag recovered fines (Moz) | 0.6 | 0.8 | 2.2 | 1.9 | 0.6 | 1.1 | 0.5 | 0.4 | 0.2 | 0.4 | 0.4 | 9.1 |
Au recovered fines (koz) | 0.0 | 0.0 | 0.1 | 0.9 | 5.0 | 2.1 | 9.8 | 9.0 | 7.2 | 5.2 | 4.2 | 43.6 |
Source: El Brocal, December 2021.
SRK Consulting (Peru) S.A. | April, 2022 |
SRK Consulting Peru SA SEC Technical Report Summary – El Brocal | Page 178 |
Table 13-16: Tajo Norte & Tajo Sur (Pb-Zn ore) open pit mining plan
Description | 2022 | 2023 | 2024 | 2025 | 2026 | 2027 | 2028 | 2029 | 2030 | 2031 | 2032 | Total |
OP treated Pb/Zn ore (Mt) | 2.10 | 2.89 | 2.00 | 0.76 | - | - | - | - | - | 0.46 | 0.21 | 8.41 |
Pb (%) | 0.96 | 1.00 | 1.52 | 0.95 | - | - | - | - | - | 0.76 | 0.34 | 1.08 |
Zn (%) | 1.65 | 1.79 | 2.81 | 3.02 | - | - | - | - | - | 1.98 | 2.43 | 2.13 |
Ag (oz/t) | 2.84 | 2.73 | 3.06 | 3.67 | - | - | - | - | - | 2.66 | 3.07 | 2.92 |
Fe (%) | 7.81 | 7.55 | 13.39 | 12.11 | - | - | - | - | - | 9.00 | 11.12 | 9.58 |
Cu (%) | 0.23 | 0.19 | 0.35 | 0.27 | - | - | - | - | - | 0.17 | 0.16 | 0.24 |
Pb recovery (%) | 35.5 | 47.7 | 50.3 | 46.8 | - | - | - | - | - | 8.7 | 37.6 | 45.4 |
Ag-Pb recovery (%) | 39.4 | 38.7 | 39.1 | 39.0 | - | - | - | - | - | 30.5 | 30.6 | 38.4 |
Zn recovery (%) | 51.4 | 53.3 | 56.2 | 56.7 | - | - | - | - | - | 53.7 | 55.7 | 54.4 |
Ag-Zn recovery (%) | 32.9 | 32.4 | 31.4 | 33.8 | - | - | - | - | - | 32.6 | 33.1 | 32.5 |
Pb recovered fines (kt) | 7.1 | 13.8 | 15.4 | 3.4 | - | - | - | - | - | 1.4 | 0.3 | 41.3 |
Zn recovered fines (kt) | 7.8 | 27.5 | 31.7 | 13.0 | - | - | - | - | - | 4.9 | 2.8 | 97.6 |
Ag recovered fines (Moz) | 4.3 | 5.6 | 4.3 | 2.0 | - | - | - | - | - | 0.8 | 0.4 | 17.4 |
Source: El Brocal, December 2021.
Note: Open pit LOM plan considers the ore from: the total ore reserves Cu and Pb/Zn (34.55 Mt ore) and the ore stock of the open pit as of December 31, 2021 (0.24 Mt ore). The total of ore reserves to be treated is 34.79 Mt
SRK Consulting (Peru) S.A. | April, 2022 |
SRK Consulting Peru SA SEC Technical Report Summary – El Brocal | Page 179 |
Project life |
Based on the estimated reserves as of December 2021, the project life is expected to run until 2032.
Mining unit dimensions (dimensions of benches and berms) |
The following design parameters have been considered for the open pit operation:
| ● | Bench height: 6 m. |
| ● | Berm width: variable between 5 and 8 m. |
| ● | Ramp width: considering equipment width, safety distances, and safety berm, the ramp width is 12 m with a 10% slope. |

Figure 13-27: Design parameters (bench, berm, y ramp)
Source: El Brocal, December 2021.
| ● | Optimum turning radius according to the equipment fleet is 6.4 m. |

Figure 13-28: Optimum turning radius
Source: El Brocal, December 2021.
SRK Consulting (Peru) S.A. | April, 2022 |
SRK Consulting Peru SA SEC Technical Report Summary – El Brocal | Page 180 |
| ● | Minimum loading width considering the excavator and the minimum spaces to carry out operational activities is 20. However, one excavator is expected to work with two trucks. As such, the estimated width can be up to 60 m. |

Figure 13-29: Loading wide area
Source: El Brocal, December 2021.
Mining dilution
Mining dilution refers to waste or low-grade rocks that are not separated from the ore during the mining process. In other words, they are unwanted rocks that are mixed with the ore and are sent to the processing plant, resulting in increased operating costs, reduced ore value, distortion of production schedules, among other consequences.
There are two approaches to the calculation of dilution:
Dilution(insitu) = | Waste rock tonnes | * 100……………………………………..(1) |
| Ore tonnes | |
Dilution(mill feed) = | Waste rock tonnes | * 100………………………..(2) |
| (Ore tonnes+Waste rock tonnes) | |
In El Brocal’s open pit, dilution was estimated based on the block model under an insitu dilution perspective (1), and based on the contour or wall of the envelope generated by the blocks that meet the following conditions:
| ● | NSR (Net Smelter Return) value of the block greater than or equal to the internal NSR Cutoff Value. |
| ● | Block category: measured or indicated. |
Based on the contour or wall of the envelope and according to the number of exposed faces in the horizontal XY plane, dilution was applied according to the values shown in Table 13-7.
Table 13-17: Insitu dilution values
Number of exposed sides per block (X Y plane) | Dilution in situ |
|---|---|
1 | 10% |
2 | 21% |
3 | 32% |
4 | 44% |
Source: SRK, June 2021
SRK Consulting (Peru) S.A. | April, 2022 |
SRK Consulting Peru SA SEC Technical Report Summary – El Brocal | Page 181 |
Figure 13-30 shows the dilution application criterion on the contour or wall of the envelope in the horizontal XY plane generated under the indicated conditions.
Figure 13-30: Ore envelope and dilution application criterion.
Source: SRK, June 2021.
Mine recovery
An ore loss of 2% has been considered for El Brocal open pit operations, i.e., an ore recovery of 98%. This value is based on open pit operations of similar production levels and the same type of deposit.
Underground Mine |
Production Schedule
El Brocal’s underground operations has as a production target 8,500 tpd of ore. Based on this, the LOM has been estimated at 11 years (2022 to 2033) exploiting 35.74 Mt Cu ore (1.27% Cu, 0.70 oz/t Ag y 0.74 g/t Au). See Table 13-18.
SRK Consulting (Peru) S.A. | April, 2022 |
SRK Consulting Peru SA SEC Technical Report Summary – El Brocal | Page 182 |
Table 13-18: Marcapunta (Cu-Ag ore) underground mining plan
Description | 2022 | 2023 | 2024 | 2025 | 2026 | 2027 | 2028 | 2029 | 2030 | 2031 | 2032 | Total |
UG treated Cu ore (Mt) | 2.94 | 3.01 | 3.07 | 3.22 | 2.80 | 2.80 | 2.81 | 2.80 | 2.80 | 2.80 | 3.43 | 32.48 |
Cu (%) | 1.64 | 1.49 | 1.29 | 1.37 | 1.26 | 1.23 | 1.23 | 1.14 | 1.31 | 1.33 | 1.20 | 1.32 |
Ag (oz/t) | 0.59 | 0.63 | 0.72 | 0.73 | 0.72 | 0.52 | 0.54 | 0.79 | 0.71 | 1.05 | 0.85 | 0.72 |
Au (g/t) | 0.46 | 0.71 | 0.59 | 0.68 | 0.57 | 0.81 | 0.89 | 1.14 | 0.86 | 1.02 | 0.79 | 0.77 |
As (%) | 0.51 | 0.50 | 0.43 | 0.48 | 0.48 | 0.47 | 0.42 | 0.44 | 0.45 | 0.47 | 0.44 | 0.46 |
Fe (%) | 16.38 | 16.33 | 17.86 | 18.16 | 23.15 | 24.35 | 21.49 | 22.11 | 19.36 | 19.88 | 17.10 | 19.53 |
Cu recovery (%) | 85.2 | 85.0 | 83.0 | 84.0 | 83.0 | 83.0 | 83.0 | 82.0 | 84.0 | 84.0 | 84.0 | 83.8 |
Ag recovery (%) | 51.0 | 51.0 | 52.0 | 52.0 | 52.0 | 50.0 | 50.0 | 52.0 | 52.0 | 55.0 | 54.0 | 52.2 |
Au recovery (%) | 30.7 | 35.0 | 34.0 | 35.0 | 34.0 | 35.0 | 36.0 | 37.0 | 36.0 | 37.0 | 35.0 | 35.3 |
As recovery (%) | 88.2 | 88.0 | 86.0 | 87.0 | 86.0 | 86.0 | 86.0 | 85.0 | 87.0 | 87.0 | 87.0 | 86.7 |
Cu recovered fines (kt) | 41.1 | 38.3 | 32.8 | 37.2 | 29.3 | 28.6 | 28.6 | 26.1 | 30.8 | 31.3 | 34.6 | 358.6 |
Ag recovered fines (Moz) | 0.9 | 1.0 | 1.1 | 1.2 | 1.0 | 0.7 | 0.8 | 1.1 | 1.0 | 1.6 | 1.6 | 12.1 |
Au recovered fines (koz) | 13.3 | 24.2 | 19.7 | 24.5 | 17.5 | 25.4 | 28.8 | 37.8 | 27.9 | 33.8 | 30.7 | 283.7 |
Source: BVN, December 2021.
SRK Consulting (Peru) S.A. | April, 2022 |
SRK Consulting Peru SA SEC Technical Report Summary – El Brocal | Page 183 |
Project life
Based on the estimated reserves as of December 2021, the project life is expected to run until 2033.
Mining unit dimensions (stope dimensions)
The underground mining methods are Sub Level Stopping with cemented back fill and Room and Pillar with long holes. The pillars left in the ground are chain pillars that run along the entire mining direction and cover the mantle’s extension.
This method varies depending on the mining area:
- | North Zone: the stope is 8 m wide, 28 m high, with length varying between 50 to 100 m, and the pillar width has been set at 6 m. |
- | South Zone includes the southwest and southeast zones: the stope is 14 m wide, 28 m high, length varying from 50 to 100 m, and the pillar is 6 m wide. |
Mining dilution
The applied dilution varies between 4% to 5% according to the mine method, and this has been configured in the mining software for the definition of ore reserves stopes.
In general, given the type of deposit are mainly mantle, a 4% dilution has been considered for cleaning and backfilling.
Mine recovery
An ore loss of 5% has been considered for El Brocal underground operations, i.e., an ore recovery of 95%, and this has been configured in the mining software for the definition of ore reserves stopes. This value is based on underground operations of similar production levels and the same type of deposit.
Requirements for Stripping, Underground Development, and Backfilling |
Open Pit |
Stripping ratio
Mining phases established for the open pit are 16, distributed between Tajo Norte and Tajo S.
SRK Consulting (Peru) S.A. | April, 2022 |
SRK Consulting Peru SA SEC Technical Report Summary – El Brocal | Page 184 |
Figure 13-31: Sequence of mining phases
Source: El Brocal, December 2021.
The stripping ratio (SR) varies according to the mining phase, on average 11 t of waste must be removed to extract 1 t of ore.
SRK Consulting (Peru) S.A. | April, 2022 |
SRK Consulting Peru SA SEC Technical Report Summary – El Brocal | Page 185 |
Table 13-19: Stripping ratio report by phase
Phase | 09 | 12 | 13 | 14 | 15 | 16 | 17 | 18 | 19 | 20 | 21 | 22 | 23 | 24 | 25 | 26 | Total |
Ore (Mt) | 0.24 | 0.85 | 3.95 | 0.00 | 0.53 | 1.40 | 1.80 | 0.23 | 0.58 | 1.70 | 0.43 | 4.14 | 4.80 | 4.55 | 3.92 | 5.44 | 34.55 |
Pb (%) | 1.00 | 0.76 | 0.79 | 0.00 | 1.37 | 0.98 | 0.82 | 0.88 | 0.51 | 0.30 | 0.00 | 0.00 | 0.00 | 0.07 | 0.00 | 0.01 | 0.26 |
Zn (%) | 3.28 | 2.91 | 0.85 | 0.00 | 3.56 | 1.69 | 1.33 | 2.07 | 1.27 | 1.05 | 0.00 | 0.01 | 0.00 | 0.18 | 0.02 | 0.08 | 0.51 |
Ag (oz/t) | 0.28 | 2.73 | 2.99 | 0.00 | 0.95 | 3.37 | 3.24 | 1.84 | 3.96 | 2.45 | 0.58 | 0.41 | 0.32 | 0.92 | 0.30 | 0.44 | 1.25 |
Cu (%) | 0.00 | 0.15 | 0.44 | 0.00 | 0.08 | 1.13 | 1.20 | 0.04 | 0.88 | 1.02 | 1.78 | 1.59 | 1.62 | 1.59 | 1.66 | 1.48 | 1.30 |
Au (g/t) | 0.00 | 0.00 | 0.00 | 0.00 | 0.00 | 0.00 | 0.00 | 0.00 | 0.01 | 0.01 | 0.02 | 0.22 | 0.33 | 0.07 | 0.37 | 0.27 | 0.17 |
Waste (Mt) | 3.32 | 2.03 | 13.79 | 19.59 | 7.26 | 9.64 | 11.82 | 11.29 | 21.86 | 22.77 | 13.31 | 38.30 | 19.90 | 21.69 | 55.09 | 106.28 | 377.94 |
SR | 14.0 | 2.4 | 3.5 | 0.0 | 13.6 | 6.9 | 6.6 | 49.1 | 37.6 | 13.4 | 31.0 | 9.3 | 4.1 | 4.8 | 14.0 | 19.6 | 10.9 |
Source: BVN, December 2021.
SRK Consulting (Peru) S.A. | April, 2022 |
SRK Consulting Peru SA SEC Technical Report Summary – El Brocal | Page 186 |
Water Drainage
El Brocal has designed a drainage plan for the management of contact and non-contact waters, with emphasis on improving mining and discharge fronts, since in the months of November to April there is evidence of the presence of rainwater (runoff superficial), in addition to a considerable groundwater recharge and subsurface seepage.
For this, an open pit drainage system was designed and implemented, installing a battery of production wells, to pump groundwater and depress the water table or piezometric level to improve exploitation conditions and comply with the mining plan.
The infrastructure installed in the open pit for the management of rainwater and groundwater recharge is detailed below.
A. | System from catchment and driving from the waters from rain or surface runoff |
Taking into consideration the hydrological analysis and the historical level of the flows, gutters have been designed and built-in material "In Situ" along the ore and waste material hauling routes to control and capture the surface runoff or rainwater.
Throughout the development of the open pit, the following types of gutters have been implemented:
A.1Typical gutter on the haul ramps
Triangular section gutters have been built on the hauling ramps, located at the foot of the slope and in some cases on both sides of the accesses. Table 13-20 shows the characteristics of the triangular section gutter.
Table 13-20: Characteristic of the triangular section gutter
Gutter | Depth H(m) | Internal Foundation (m) | Base external (m) | Total Basis (m) | Slope Internal (V:H) | Slope external (V:H) |
CU-1 | 0.8 | 0.8 | 0.4 | 1.2 | 1:1.25 | 1:0.5 |
Source: BVN, January 2022.
Figure 13-32: Detail of triangular gutter design
Source: El Brocal
The gutters are built during the dry season or when the rains are absent (May - October); during the rainy season (November – April) the infrastructure maintenance is permanent due to clogging of the gutters.
SRK Consulting (Peru) S.A. | April, 2022 |
SRK Consulting Peru SA SEC Technical Report Summary – El Brocal | Page 187 |
Figure 13-33 shows the location of access roads to the Tajo Norte and part of the Tajo Sur.

Figure 13-33: Location from the gutters with priority in the haul roads
Source: El Brocal
A.2Typical gutter on the sidewalks
- | Wall Norte the open pit – Phase 9E |
In this sector in banks 4285, 4294, 4303 and 4312 coated gutters will be built, due to being on the projection of a geotechnical fault, with in order to prevent runoff water from infiltrating and percolating in the banks lower and generate a saturation condition. The Figure 13-34 shows application scheme.
SRK Consulting (Peru) S.A. | April, 2022 |
SRK Consulting Peru SA SEC Technical Report Summary – El Brocal | Page 188 |

Figure 13-34: Section typical on sidewalks
Source: El Brocal
- | Gutter design on the north wall of open pit |
The design of gutters projected in this sector has been estimated considering the hydrological analysis and the design flow. The typical section selected for this type of hydraulic infrastructure is trapezoidal way. This gutter has been coated with 1.5 mm HDPE geomembrane. Table 13-21 details the characteristics of the section, the Figure 13-35 shows the typical section.
Table 13-21: Details the characteristics of the section
Structure | Dimensions Finals (m) | Pending | Coating | Ability (l/s) | |||
| Base | Height | Slope | Edge Free | minimum | | |
Gutter | 0.4 | 0.5 | 01:01 | 0.1 | 0.20% | Geomembrane 1.5 mm | 80 |
Source: El Brocal

Figure 13-35: Detail of trapezoidal gutter design
Source: El Brocal
SRK Consulting (Peru) S.A. | April, 2022 |
SRK Consulting Peru SA SEC Technical Report Summary – El Brocal | Page 189 |
The Figure 13-36 shows the gutters coated with geomembrane on the north side of the open pit.

Figure 13-36: Gutters coated with geomembrane on the north side of the open pit
Source: El Brocal
| ● | Gutters on Condorcayan dump |
| ● | In the east, west and north zones of the Condorcayan dump there are perimeter gutters, coated with 1.5mm thick geomembrane, of approximately 3,360m. Figure 13-37 shows the location of the gutters. |

Figure 13-37: Location of the gutters on Condorcayan dump
Source: El Brocal
| ● | Gutters on South dump |
| ● | Figure 13-38 shows the waterproofing gutter with 1.5 mm geomembrane on the perimeter of the South dump, which carries the waters to an uptake station and through an HDPE |
SRK Consulting (Peru) S.A. | April, 2022 |
SRK Consulting Peru SA SEC Technical Report Summary – El Brocal | Page 190 |
pipe (8 "diameter) to lead them to the pique Lumbreras. Figure 13-39 shows the location of the perimeter and coronation channels in the area of direct influence of the South dump.

Figure 13-38: View the waterproofing gutter on the perimeter of the South dump
Source: El Brocal
SRK Consulting (Peru) S.A. | April, 2022 |
SRK Consulting Peru SA SEC Technical Report Summary – El Brocal | Page 191 |

Figure 13-39: Location of the perimetral and crowning gutter of the South dump
Source: El Brocal
B | Current infrastructure for pumping groundwater in the open pit |
Groundwater are a problem of operational productivity and a potential security risk in open pit and underground mining. The presence and pressure of groundwater in geological discontinuities adversely affects the safety and geometric configuration of bench height and slope angles of the open pit.
To depress the water or piezometric level, it is necessary to reduce the pressure of groundwater in its vicinity, as well as a groundwater management plan in order to dimension and install the pumping system according to local and regional potential recharge of groundwater.
B.1Production wells (Open pit drainage)
In order to improve drain conditions of the open pit in 2016, 5 tubular wells (14 "diameter) were drilled, located at levels 4162 and 4169 of 150 m deep on average. In 2019, 2 tubular wells (12 "diameter) were drilled, with the aim of keeping the water level in equilibrium, located in the northern zone of the open pit, one on the east side and the other on the west side, at level 4158 (122m) and 4175 (130m) respectively.
The PCN 07 well has a flow average from exploitation of 42.0 l/s. The groundwater pumping is conducted through HDPE pipes (8” diameters), which discharge at the Poza Metropolitano pumping station. Figure 13-40 shows the location of drainage wells.
SRK Consulting (Peru) S.A. | April, 2022 |
SRK Consulting Peru SA SEC Technical Report Summary – El Brocal | Page 192 |

Figure 13-40: Location of drainage wells on the open pit
Source: El Brocal
B.2 | Pumping equipment in the open pit |
Table 13-22 shows the characteristics of the pumping equipment installed in each drain well.
Table 13-22: Characteristics of the pumping equipment in the open pit
| Data the Motor | Data from the Bomb | |||||||||
Water well | Brand | Model | No. from Serie | Power | Voltage | Brand | Model | Number of stages | Diameter from Download | Pressure | Flow (l/s) |
PCN - 7 | SME | 10INCH-200HP-2P | 1302DP3263 | 200 hp (150 kW) | 460 v | National Pump | SH10HC-3 | 03 stages | 8" | 145 | 42 |
Source: El Brocal
C | Stations installed in the open pit |
C.1“El Metropolitano” pumping station
Storage and water pumping station of surface runoff waters (rain) and water filtrations coming from the Condorcayan dump, located in northeast of the open pit, at level 4294. This infrastructure has two "ships"; one to decant the sediments and the other for water storage. Approximately their capabilities are of 1,100 m³ and 3,200 m³ respectively. See Figure 13-41.
SRK Consulting (Peru) S.A. | April, 2022 |
SRK Consulting Peru SA SEC Technical Report Summary – El Brocal | Page 193 |

Figure 13-41: “El Metropolitano” water storage and pumping station, level 4294
Source: El Brocal
C.2“Bottom of the Open Pit” pumping station
Located at the bottom of the open pit on the north side (4150 level), built on "in-situ" material, which captures surface runoff waters (rain) and groundwater filtrations coming from the South Gallery and the East Gallery. See Figure 13-42.
The location of the station is temporary, as it is based on the mining and discharge plan short, medium, and long term.
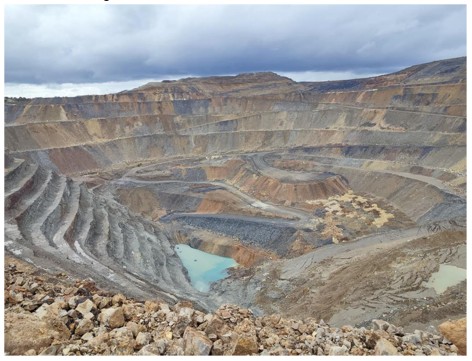
Figure 13-42: Poza on the bottom of the open pit, temporarily located at level 4150
Source: El Brocal
SRK Consulting (Peru) S.A. | April, 2022 |
SRK Consulting Peru SA SEC Technical Report Summary – El Brocal | Page 194 |
C.3“Poza la Llave” pumping station
Located at level 4250 with a storage capacity of 2,500 m³. Poza has a coating and waterproofing of geotextile and geomembrane. See Figure 13-43.
The pumping station receives the waters of South Poza and then pumped to the industrial water treatment plant.
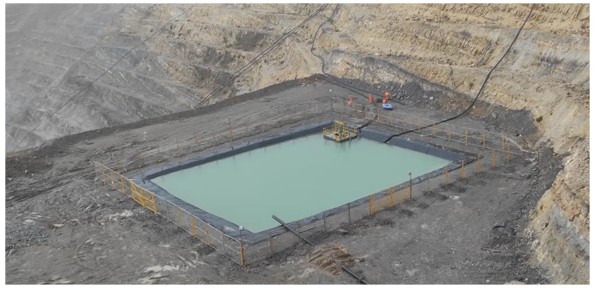
Figure 13-43: "Poza la Llave" pumping station, located at level 4250
Source: El Brocal
Underground |
Explorations, Developments, and Preparations
The activities carried out in the design and mining process at the Marcapunta Norte underground mine are detailed below.
Explorations
Crossings and windows with a 4.5 x 4.5 section are built, whose main objective is to generate diamond drilling chambers. The typical section is the same as that of the main accesses because these are later used to start development work.
Developments
Mine development is carried out according to a specific objective, so we have:
| ● | Negative-positive ramp (section 4.5 x 4.5). Access ramp to the lower gallery that will serve for the mobilization of personnel and equipment, as well as for the extraction of broken ore. |
| ● | Pumping Chambers (section 4.0 x 4.0). Chamber with a negative slope of 15%, located in the lower gallery, will serve to capture the water generated by drilling and filtration. |
| ● | Accumulation and loading chambers (section 4.0 x 4.5). Chambers located in the lower gallery, which will serve for the accumulation and loading of the broken ore. |
| ● | Shelters (section 2.0 x 2.5). Cameras located in the ramps and galleries, which serve as a pedestrian shelter and for an electrical panel, which must be properly marked. |
SRK Consulting (Peru) S.A. | April, 2022 |
SRK Consulting Peru SA SEC Technical Report Summary – El Brocal | Page 195 |
| ● | Ventilation and services chimney (section 3.0 Ø). The chimney is located according to the design of each block, the objective being to guarantee the entry of clean air, the exit of stale air, and the entry of services (water, air, energy). |
| ● | RB (section 4.0 Ø). These are works that communicate with the surface and are located at the ends of each zone or sector, the lengths range from 200 m to 350 m. being able to be greater as the mine deepens. |
Preparations
| ● | Upper main galleries (Section 4.0 x 4.5). Its objective is to prepare the mineralized block from the upper part, from these the upper sublevels will be executed, leaving continuous pillars. Throughout the mining process it will serve as access to personnel, equipment, and services. |
| ● | Lower main galleries (Section 4.0 x 4.5). Its objective is to prepare the mineralized block from the lower part. From these, the lower sublevels will be executed, leaving continuous pillars. It will serve as access to personnel, services, and equipment. Here the cleaning and loading of ore will be carried out. |
| ● | Upper and lower secondary gallery (Section 3.9 x 3.7). Its objective is to carry out drilling and blasting, the ore cleaning will be carried out in the lower part. |
| ● | Shelters (section 2.0 x 2.5). Chambers located in the secondary galleries, spaced every 15 meters. |
| ● | Slot (section 4.0 x 4.0). Tillage generally located at the end of the secondary galleries, from these the VCR chimney is made, and opening of the slot trench. |
| ● | VCR Chimney (section 2.1 x 2.1). The VCR or Slot will be located at the end of the pit where the exploitation will begin. Once the VCR chimney has been completed, the slot trench will be expanded to continue with the production lines. |
Construction general scheme of underground mine
The following graphs show the general scheme of distribution of the underground mine, for the mining of the primary and secondary stopes.
SRK Consulting (Peru) S.A. | April, 2022 |
SRK Consulting Peru SA SEC Technical Report Summary – El Brocal | Page 196 |

Figure 13-44: 3D view of the scheme of sublevel stoping mining method with continuous pillars
Source: BVN

Figure 13-45: Plan view of the scheme of sublevel stoping mining method with continuous pillars
Source: BVN
SRK Consulting (Peru) S.A. | April, 2022 |
SRK Consulting Peru SA SEC Technical Report Summary – El Brocal | Page 197 |

Figure 13-46: Profile view of the scheme of sublevel stoping mining method with continuous pillars.
Source: BVN

Figure 13-47: Profile view of the scheme of sublevel stoping mining method with continuous pillars, leaving a bridge pillar in the areas where it has been mined with chambers and pillars in the upper part.
Source: BVN
SRK Consulting (Peru) S.A. | April, 2022 |
SRK Consulting Peru SA SEC Technical Report Summary – El Brocal | Page 198 |

Figure 13-48: Profile view of the scheme of the sublevel stoping mining method with continuous pillars, leaving shield pillars so as not to affect the main extraction access galleries.
Source: BVN
Mine backfill
Currently, there is no system in place for the generation and distribution of "cemented backfill".
The waste rock generated in the development and preparation work is used as "detrital fill" for the primary pits mined to improve the stability of openings and to avoid incurring costs for transporting waste rock to the dumps. The detrital fill is moved and distributed using scooptrams.
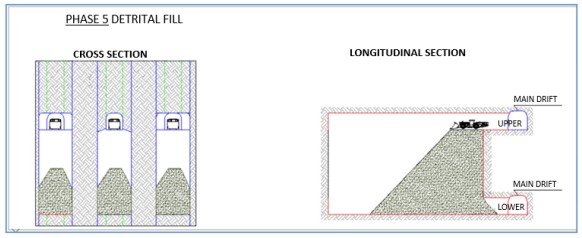
Figure 13-49: Profile view of the scheme detrital fill
Source: BVN
SRK Consulting (Peru) S.A. | April, 2022 |
SRK Consulting Peru SA SEC Technical Report Summary – El Brocal | Page 199 |
Required Mining Equipment Fleet and Machinery |
13.4.1Open pit mining equipment
The main equipment for operation, auxiliary services, and electric power is listed in the following tables:
Table 13-23: San Martin contractor company’s equipments
Equipment | Capacity | Quantity (units) |
|---|---|---|
Lube trucks | - | 1 |
Front end loader | 4 m3 | 1 |
Water tank | 5000 Gal | 2 |
Fuel tank | 5000 Gal | 3 |
Crawler excavator | 5.6 m3 | 7 |
| 4.6 m3 | 2 |
| 1.8 m3 | 1 |
Hydraulic hammer | - | 1 |
Backhoe | 1 m3 | 1 |
Motor grader | 3.7m x 0.61m | 1 |
| 4.2 m x 0.63m | 2 |
Crawler-mounted rotary drill rig | 5 - 9 inch | 4 |
Compacting roller | 9.5 t | 1 |
| - | 1 |
Tractor | 10 m3 | 4 |
| 5.6 m3 | 2 |
Grand total |
| 34 |
DUMP TRUCK | 24.5 m3 | 58 |
| 20 m3 | 5 |
Grand total |
| 63 |
Source: El Brocal
Table 13-24: Smelter contractor company’s equipments
Equipment | Brand | Model | Capacity | Quantity (units) |
Crawler excavator | Caterpillar | 336 | 1.8 m3 | 1 |
Crawler excavator | Caterpillar | 390 | 5.6 m3 | 1 |
Front end loader | Caterpillar | 966H | 4 m3 | 1 |
Dump truck | Mercedes Benz | Actros | 20 m3 | 12 |
Grand total |
|
|
| 15 |
Source: El Brocal
Table 13-25: Ecosarc contractor company' equipments
Equipment | Brand | Model | Capacity | Quantity (units) |
Crawler excavator | Caterpillar | 336 CAT | 1.8 m3 | 1 |
Backhoe | - | 420 F2 | 1 m3 | 1 |
Grand total |
|
|
| 2 |
Source: El Brocal
SRK Consulting (Peru) S.A. | April, 2022 |
SRK Consulting Peru SA SEC Technical Report Summary – El Brocal | Page 200 |
Underground mining equipment |
The underground mine is operated by specialized contractors:
| ● | Empresa Comunal de Servicios Múltiples Smelter S.A.: ore and waste rock haulage, road maintenance. |
| ● | JRC Ingeniería y Construcción S.A.C.: advances, production, auxiliary services, support. |
The main equipment for operation, auxiliary services, and electric power is listed in the following table:
Table 13-26: Underground mining equipment
Equipment | Brand | Model | Capacity | Type | Quantity |
|---|---|---|---|---|---|
Scoop 6.0 yd3 | Sandvik | LH410 | 6.0 YD3 | Diesel | 9 |
Scoop 6.0 yd3 | Cat | R1600H | 6.0 YD3 | Diesel | 1 |
Scoop 6.0 yd3 | Sandvik | LH410 | 6.0 YD4 | Diesel | 4 |
Scoop 6.0 yd3 | Cat | R1600H | 6.0 YD3 | Diesel | 2 |
Scoop 6.0 yd3 | Cat | R1600G | 6.0 YD3 | Diesel | 1 |
Jumbo Atlas 2 Arm | Atlas | RB282 | 16 FEET | Electric | 5 |
Bolter | Resemin | BOLTER 99 |
| Electric | 1 |
Bolter | Atlas | BOLTEC 235 |
| Electric | 2 |
Bolter | Sandvik | DS310 |
| Electric | 2 |
Simba S7D 64mm | Atlas | S7D |
| Electric | 3 |
Simba S7D 89mm | Atlas | H1254 |
| Electric | 2 |
Simba S7D 64mm | Epiroc | S7D |
| Electric | 1 |
Simba S7D 89mm | Resemin | RAPTOR 55-2R |
| Electric | 1 |
Scaler (Pauss) | Paus | 853-S8 |
| Diesel | 5 |
Utility Telehandler | Manitou | MTX1030ST |
| Diesel | 4 |
Utility Telehandler | Manitou | MTX1033S MINING |
| Diesel | 2 |
Robotic Shotcrete Equipment | Putzmeister | SPM 4210 |
| Diesel | 2 |
Robotic Shotcrete Equipment | Normet | ALPHA 20 |
| Diesel | 2 |
Mixer (Concrete Mixer) | Putzmeister | MIXKRET 4 |
| Diesel | 1 |
Mixer (Concrete Mixer) | Normet | TORNADO S2 |
| Diesel | 6 |
30,000 CFM fan | Airtec |
|
|
| 40 |
32,000 CFM fan | Airtec |
|
|
| 1 |
60,000 CFM fan | Airtec |
|
|
| 9 |
Grand total |
|
|
|
| 106 |
Trucks | Mercedes benz | ACTROS 3344 K | 15 m3 | Diesel | 25 |
Grand total |
|
|
|
| 25 |
Source: El Brocal
Final Mine Outline Map |
13.5.1General arrangement open pit and underground mining component
Figure 13-50 shows the final disposition of the main components of open pit and underground mining operations.
SRK Consulting (Peru) S.A. | April, 2022 |
SRK Consulting Peru SA SEC Technical Report Summary – El Brocal | Page 201 |
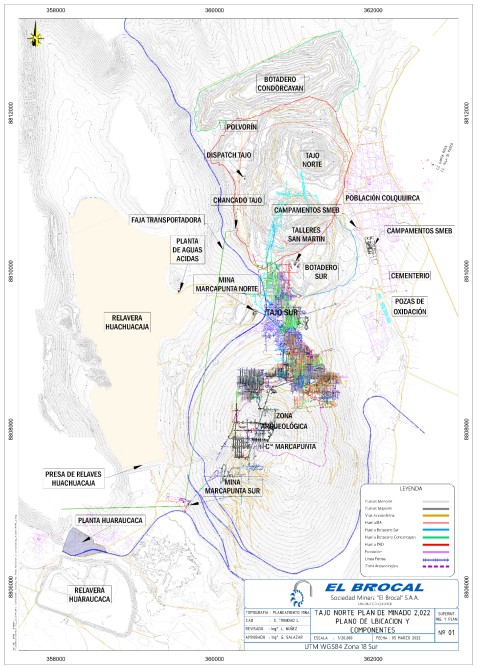
Figure 13-50: Disposition of the main components of open pit and underground mining operations
Source: El Brocal
SRK Consulting (Peru) S.A. | April, 2022 |
SRK Consulting Peru SA SEC Technical Report Summary – El Brocal | Page 202 |
13.5.2Isometric and longitudinal plans
Figure 13-51 show a longitudinal view of open pit and underground mining operations.

Figure 13-51: Longitudinal view of open pit and underground mining operations
Source: SRK, December 2021.
SRK Consulting (Peru) S.A. | April, 2022 |
SRK Consulting Peru SA SEC Technical Report Summary – El Brocal | Page 203 |
Recovery Methods |
El Brocal operates two independent conventional flotation plants, namely Plant 1 and Plant 2. Plant 1 processes copper ore from Marcapunta mine to recover copper minerals in order to produce copper concentrate. Plant 2 processes lead and zinc ores from, mostly from the Tajo Norte mine, to recover lead and zinc minerals with the purposes of producing lead concentrate and zinc concentrate (see Figure 14-1).

Figure 14-1: El Brocal, Fresh Ore Destination and Final Products
Source: SRK
Plant 1 - Copper Ore |
Plant 1 is a conventional concentration plant producing copper concentrate that is transported offsite by dump trucks, and to a lesser extent, rail cars, for sale to third parties. The plant’s unit processes include crushing, grinding, flotation, and thickening. Final tails are thickened and disposed of in a conventional tailings storage facility. Final concentrate generated in the flotation stage is thickened, then dewatered before being sent to Callao Port. A simplified block flow diagram of Plant 1 is shown in Figure 14-2 and the detailed flowsheet is shown in Figure 14-3.
Ore Delivery |
Ore mined from the open pit and underground works is re-handled multiple times before being delivered to the mill facilities. More specifically, at the mining face ore is loaded onto approximately 30-tonne dump trucks, then delivered to an intermediate stockpiling area where it is classified according to grade criteria; it is then reloaded prior to being sent to the mill feed stockpile. It is SRK’s understanding that this multiple rehandling is a consequence of agreements between El Brocal and local communities. These agreements include the hiring of local companies to provide all trucking and loading equipment. These unnecessary ore re-handling is likely translating into additional operating expenditures for El Brocal.
SRK Consulting (Peru) S.A. | April, 2022 |
SRK Consulting Peru SA SEC Technical Report Summary – El Brocal | Page 204 |
Plant 1 – Crushing Stage |
Dump trucks deliver fresh ore to a coarse ore bin, which has a capacity of 100 tonnes and is equipped with a rock breaker as well as a stationary 20” opening grizzly. The grizzly’s passing size directly feeds a 47” x 33” jaw crusher operating with a 4” close side setting. The crusher discharge is conveyed to a primary 8’ x 20’ double-deck classification vibrating screen whose passing ½” stream becomes the final product from the crushing plant that is conveyed to a stockpile. The coarse stream from the primary screen feeds a secondary closed-circuit crushing-classification stage consisting of a secondary cone crusher operating with a close-side setting of 47 mm and a secondary double-deck vibrating screen with a ½” passing size. A fraction of the secondary vibrating screen’s coarse stream feeds a tertiary cone crusher operating in open circuit with a close-side setting of 13mm. Alternatively, the secondary screen’s coarse fraction feeds a second tertiary cone crusher with a close-side setting of 10mm operating in open circuit. Product from both tertiary cone crushers becomes final product from the crushing plant that is conveyed to the stockpile.
The crushing plant’s final product sizing approximately P80= ½” is stored on two covered stockpiles of 6,000 tonnes and 2,000 tonnes each.
Plant 1 – Grinding & Classification |
The grinding and classification stage consists of primary grinding in an open circuit followed by a classification stage, where hydrocyclones feed the coarse fraction to a secondary grinding stage that operates in a close-circuit with a multi-deck vibrating screen.
A fine ore reclaim system feeds the primary grinding stage, which consists of a 7” x 12” and 550 HP single rod mill operating in open circuit. The rod mill product feeds a hydrocyclone classification stage. The hydrocyclone’s coarse fraction feeds the secondary ball mill consisting of a 16.5” x 23’ and 400 HP ball mill. Ball mill discharge along with hydrocyclones fines stream feeds six multi-deck (5 decks) vibrating screens. The screen’s passing (fine fraction) fraction becomes final grinding product and feeds the flotation stage. The screen’s coarse fraction is returned to the ball mill.
Plant 1 – Flotation & Regrinding |
The grinding product sizing approximately P80=xx mm feeds a mechanically agitated 20’ diameter x 20’ long conditioning tank that overflows onto the rougher flotation stage consisting of three mechanically agitated forced air cells. The first rougher concentrate becomes final copper concentrate stream that is pumped to the copper concentrate thickener.
The first rougher tails feed and inverse regrinding and classification stage using a 13.5’ x 22.6’ and 2750 hp ball mill and a cluster of hycrocyclones. The hydrocyclone’s fines stream feeds a multi-stage rougher 1 (2 cells) and rougher 2 (2 cells), followed by a scavenger flotation circuit of 5 flotation cells. Both rougher 1 and rougher 2 concentrates feed the cleaning flotation stage. Rougher-scavenger’s tails become final tails that are sent to the tails thickener.
Rougher concentrate feeds the first cleaning stage consisting of six DR-180 cells; its concentrate stream feed the second cleaning stage and its tails are recirculated to the regrinding stage. The second cleaning stage uses six DR-300 cells, its concentrate stream becomes final copper concentrate, and its tails feed the cleaning-scavenger stage consisting of six DR-300 cells. The
SRK Consulting (Peru) S.A. | April, 2022 |
SRK Consulting Peru SA SEC Technical Report Summary – El Brocal | Page 205 |
cleaning-scavenger stage’s concentrate stream is recirculated back to the second cleaner feed, and its tails are recirculated back to the rougher 1 stage.
Plant 1 – Concentrate Thickening & Filtration |
Final copper concentrate feeds a 60’ diameter x 10’ high thickener; solid discharge is dewatered in a 2m x 2m x 23 plates press filter to produce a final copper concentrate with an approximate moisture of 12% w/w that is ready for trucking off site.
Plant 1 – Final Tails |
The tails stream discharged from the flotation circuit is transferred to a 45’ diameter x 6 meter high thickener. The thickener’s discharge is transferred to a conventional tailings storage facility named Represa Huachuacaja. No water is reclaimed from either the final tails thickener nor from the tailings storage facility.
Figure 14-2: Simplified Block Flow Diagram, Plant 1
Source: BVN
SRK Consulting (Peru) S.A. | April, 2022 |
SRK Consulting Peru SA SEC Technical Report Summary – El Brocal | Page 206 |
Figure 14-3: El Brocal, Plant 1 Flowsheet
Source: BVN
Plant 1, Operational Performance |
El Brocal’s Plant 1 operational results for the 2017 to 2020 period are shown by month in Table 14-1. Note that in the last four years, Concentrate 2 was produced for only a limited number of months during the second half of both 2018 and 2019.
SRK Consulting (Peru) S.A. | April, 2022 |
SRK Consulting Peru SA SEC Technical Report Summary – El Brocal | Page 207 |
Table 14-1: Plant 1 – Copper Ore 2017 – 2020 Monthly Production Results
Period | Fresh Feed | Copper Concentrate 1 | Copper Concentrate 2 | |||||||||||||||||||||||||||
Ore, tonnes | Grade Ag oz/t | Grade Cu% | Grade As% | Grade Fe% | Grade Au g/t | Grade CuOx % | Concentrate 1 tonnes | Mass pull | Grade Ag oz/t | Grade Cu% | Grade As% | Grade Fe% | Grade Au g/t | Recovery Ag | Recovery Cu | Recovery As | Recovery Fe | Recovery Au | Concentrate 2 tonnes | Con Cu 02 Ratio | Grade Cu% | Grade As% | Grade Fe% | Grade Au g/t | Recovery Cu | Recovery As | Recovery Fe | Recovery Au | ||
2017 | 1 | 222,063 | 0.62 | 1.7% | 0.5% | 15.4% | 0.42 | 0.1% | 13,734 | 6.2% | 6.1 | 25.4% | 8.4% | 18.9% | 3.30 | 61% | 93% | 94% | 8% | 49% | ||||||||||
2 | 179,216 | 0.68 | 2.1% | 0.7% | 17.2% | 0.52 | 0.1% | 13,410 | 7.5% | 5.2 | 25.9% | 8.7% | 18.8% | 3.63 | 57% | 93% | 94% | 8% | 52% | |||||||||||
3 | 208,145 | 0.58 | 1.9% | 0.6% | 17.7% | 0.66 | 0.1% | 15,021 | 7.2% | 4.7 | 25.0% | 8.3% | 19.4% | 4.77 | 58% | 94% | 95% | 8% | 52% | |||||||||||
4 | 154,718 | 0.65 | 2.0% | 0.6% | 17.2% | 0.64 | 0.1% | 11,142 | 7.2% | 5.3 | 25.9% | 8.5% | 19.1% | 4.66 | 59% | 94% | 94% | 8% | 53% | |||||||||||
5 | 212,089 | 0.60 | 1.9% | 0.6% | 14.8% | 0.55 | 0.1% | 14,958 | 7.1% | 5.4 | 25.5% | 8.5% | 18.9% | 3.90 | 64% | 94% | 95% | 9% | 50% | |||||||||||
6 | 192,964 | 0.65 | 1.9% | 0.6% | 14.7% | 0.56 | 0.1% | 13,865 | 7.2% | 5.9 | 25.1% | 8.3% | 18.0% | 3.97 | 65% | 94% | 95% | 9% | 51% | |||||||||||
7 | 222,662 | 0.63 | 1.9% | 0.6% | 15.3% | 0.58 | 0.1% | 15,488 | 7.0% | 6.1 | 26.1% | 8.6% | 16.8% | 4.21 | 67% | 94% | 95% | 8% | 51% | |||||||||||
8 | 218,412 | 0.60 | 1.9% | 0.6% | 15.1% | 0.56 | 0.1% | 14,802 | 6.8% | 5.8 | 26.5% | 8.6% | 16.8% | 4.02 | 65% | 93% | 95% | 8% | 49% | |||||||||||
9 | 222,259 | 0.63 | 1.9% | 0.6% | 15.7% | 0.49 | 0.1% | 15,240 | 6.9% | 6.3 | 25.7% | 8.3% | 18.5% | 3.55 | 68% | 93% | 95% | 8% | 50% | |||||||||||
10 | 212,680 | 0.82 | 1.9% | 0.6% | 16.2% | 0.56 | 0.1% | 14,126 | 6.6% | 7.9 | 26.9% | 8.8% | 17.5% | 4.04 | 64% | 94% | 94% | 7% | 48% | |||||||||||
11 | 234,838 | 0.79 | 1.9% | 0.6% | 15.5% | 0.55 | 0.1% | 16,736 | 7.1% | 7.3 | 25.1% | 8.2% | 18.0% | 3.58 | 66% | 93% | 95% | 8% | 47% | |||||||||||
12 | 244,355 | 0.69 | 1.9% | 0.6% | 15.0% | 0.63 | 0.1% | 16,272 | 6.7% | 6.3 | 26.3% | 8.6% | 17.1% | 4.57 | 61% | 92% | 93% | 8% | 48% | |||||||||||
2018 | 1 | 206,875 | 0.61 | 1.9% | 0.6% | 14.8% | 0.78 | 0.1% | 13,932 | 6.7% | 5.3 | 26.0% | 8.6% | 17.6% | 5.68 | 59% | 93% | 94% | 8% | 49% | ||||||||||
2 | 212,169 | 0.53 | 1.6% | 0.5% | 15.8% | 0.65 | 0.1% | 12,326 | 5.8% | 5.5 | 25.4% | 8.4% | 17.5% | 5.31 | 61% | 92% | 93% | 6% | 48% | |||||||||||
3 | 246,212 | 0.64 | 1.7% | 0.6% | 15.9% | 0.67 | 0.1% | 14,552 | 5.9% | 6.6 | 27.2% | 9.0% | 15.7% | 5.08 | 61% | 92% | 93% | 6% | 45% | |||||||||||
4 | 208,675 | 1.10 | 1.6% | 0.5% | 14.9% | 0.58 | 0.1% | 12,327 | 5.9% | 12.4 | 24.9% | 8.1% | 17.4% | 3.94 | 67% | 92% | 93% | 7% | 40% | |||||||||||
5 | 225,391 | 0.87 | 1.8% | 0.6% | 16.5% | 0.79 | 0.1% | 14,114 | 6.3% | 8.9 | 26.5% | 8.7% | 17.3% | 4.93 | 65% | 91% | 92% | 7% | 39% | |||||||||||
6 | 244,751 | 0.71 | 1.6% | 0.5% | 15.8% | 0.53 | 0.1% | 13,873 | 5.7% | 7.9 | 25.1% | 8.2% | 17.7% | 3.78 | 63% | 91% | 91% | 6% | 41% | 4,168 | 1.7% | 24.9% | 8.3% | 17.6% | 4.04 | 27% | 28% | 2% | 13% | |
7 | 242,593 | 0.68 | 1.6% | 0.5% | 16.3% | 0.36 | 0.1% | 14,042 | 5.8% | 7.0 | 25.7% | 8.4% | 18.2% | 2.70 | 60% | 90% | 92% | 6% | 44% | 2,966 | 1.2% | 25.7% | 8.5% | 16.3% | 3.37 | 19% | 19% | 1% | 12% | |
8 | 270,977 | 0.75 | 1.6% | 0.5% | 16.7% | 0.41 | 0.1% | 15,357 | 5.7% | 7.5 | 25.5% | 8.4% | 18.6% | 3.00 | 57% | 90% | 91% | 6% | 41% | |||||||||||
9 | 261,284 | 0.75 | 1.6% | 0.5% | 16.1% | 0.42 | 0.1% | 15,792 | 6.0% | 7.7 | 24.7% | 8.1% | 18.5% | 2.75 | 62% | 91% | 91% | 7% | 40% | 2,947 | 1.1% | 24.9% | 8.1% | 17.3% | 2.72 | 17% | 17% | 1% | 7% | |
10 | 241,651 | 0.69 | 1.6% | 0.5% | 15.7% | 0.38 | 0.1% | 13,476 | 5.6% | 8.2 | 25.8% | 8.5% | 16.6% | 2.46 | 66% | 91% | 91% | 6% | 36% | 221 | 0.1% | 35.3% | 11.5% | 9.9% | 3.85 | 2% | 2% | 0% | 1% | |
11 | 196,771 | 0.76 | 1.7% | 0.5% | 16.0% | 0.40 | 0.1% | 11,547 | 5.9% | 8.7 | 25.9% | 8.5% | 17.3% | 2.79 | 66% | 92% | 92% | 6% | 41% | 5,625 | 2.9% | 24.8% | 8.1% | 19.6% | 2.46 | 43% | 43% | 4% | 18% | |
12 | 242,485 | 0.59 | 1.7% | 0.5% | 16.8% | 0.45 | 0.1% | 14,344 | 5.9% | 5.9 | 25.5% | 8.4% | 17.3% | 2.83 | 59% | 90% | 91% | 6% | 37% | 4,052 | 1.7% | 23.3% | 7.3% | 19.5% | 3.20 | 23% | 22% | 2% | 12% | |
2019 | 1 | 256,990 | 0.66 | 1.5% | 0.5% | 16.9% | 0.40 | 13,565 | 5.3% | 7.2 | 25.8% | 8.5% | 17.2% | 2.71 | 57% | 91% | 91% | 5% | 36% | 225 | 0.1% | 19.9% | 6.6% | 22.4% | 3.83 | 1% | 1% | 0% | 1% | |
2 | 219,636 | 0.69 | 1.5% | 0.5% | 17.5% | 0.42 | 12,586 | 5.7% | 6.4 | 24.5% | 8.0% | 19.2% | 2.39 | 53% | 91% | 92% | 6% | 33% | ||||||||||||
3 | 215,542 | 0.76 | 1.5% | 0.5% | 18.3% | 0.62 | 11,642 | 5.4% | 7.2 | 25.9% | 8.6% | 17.8% | 3.93 | 51% | 91% | 92% | 5% | 34% | ||||||||||||
4 | 206,417 | 1.07 | 1.7% | 0.6% | 17.8% | 0.51 | 12,929 | 6.3% | 11.2 | 24.9% | 8.2% | 20.1% | 3.14 | 66% | 91% | 91% | 7% | 38% | ||||||||||||
5 | 213,374 | 0.66 | 1.6% | 0.5% | 16.9% | 0.42 | 11,912 | 5.6% | 6.8 | 26.0% | 8.6% | 19.1% | 3.01 | 58% | 91% | 91% | 6% | 40% | ||||||||||||
6 | 232,276 | 0.60 | 1.7% | 0.6% | 16.7% | 0.50 | 14,056 | 6.1% | 5.7 | 25.9% | 8.5% | 19.0% | 3.17 | 57% | 92% | 92% | 7% | 38% | ||||||||||||
7 | 216,681 | 0.95 | 2.0% | 0.7% | 17.5% | 0.59 | 15,975 | 7.4% | 8.3 | 25.1% | 8.3% | 19.6% | 3.54 | 65% | 93% | 93% | 8% | 44% | 4,473 | 2.1% | 24.4% | 8.1% | 17.8% | 3.17 | 25% | 25% | 2% | 11% | ||
8 | 200,241 | 0.74 | 1.9% | 0.6% | 19.2% | 0.56 | 14,074 | 7.0% | 6.2 | 25.2% | 8.4% | 19.5% | 3.50 | 59% | 91% | 92% | 7% | 44% | 340 | 0.2% | 26.3% | 8.7% | 15.6% | 3.30 | 2% | 2% | 0% | 1% | ||
9 | 195,160 | 1.00 | 1.8% | 0.6% | 19.4% | 0.65 | 13,367 | 6.8% | 8.7 | 23.8% | 7.9% | 21.0% | 3.57 | 60% | 88% | 89% | 7% | 37% | 4,700 | 2.4% | 26.2% | 8.7% | 17.3% | 3.44 | 34% | 35% | 2% | 13% | ||
10 | 218,498 | 0.58 | 1.6% | 0.5% | 20.5% | 0.54 | 12,975 | 5.9% | 5.5 | 24.8% | 8.1% | 20.0% | 3.49 | 56% | 90% | 91% | 6% | 38% | 4,390 | 2.0% | 26.0% | 8.5% | 17.4% | 3.40 | 32% | 32% | 2% | 13% | ||
11 | 218,714 | 0.68 | 1.7% | 0.6% | 21.2% | 0.67 | 14,796 | 6.8% | 5.7 | 24.1% | 8.0% | 20.1% | 3.78 | 56% | 93% | 94% | 6% | 38% | ||||||||||||
12 | 202,997 | 0.73 | 1.7% | 0.6% | 20.0% | 0.57 | 12,430 | 6.1% | 7.2 | 25.6% | 8.5% | 18.5% | 4.00 | 60% | 92% | 93% | 6% | 43% | 4,211 | 2.1% | 23.6% | 7.8% | 20.3% | 3.59 | 29% | 29% | 2% | 13% | ||
SRK Consulting (Peru) S.A. | April, 2022 |
SRK Consulting Peru SA SEC Technical Report Summary – El Brocal | Page 208 |
Period | Fresh Feed | Copper Concentrate 1 | Copper Concentrate 2 | |||||||||||||||||||||||||||
Ore, tonnes | Grade Ag oz/t | Grade Cu% | Grade As% | Grade Fe% | Grade Au g/t | Grade CuOx % | Concentrate 1 tonnes | Mass pull | Grade Ag oz/t | Grade Cu% | Grade As% | Grade Fe% | Grade Au g/t | Recovery Ag | Recovery Cu | Recovery As | Recovery Fe | Recovery Au | Concentrate 2 tonnes | Con Cu 02 Ratio | Grade Cu% | Grade As% | Grade Fe% | Grade Au g/t | Recovery Cu | Recovery As | Recovery Fe | Recovery Au | ||
2020 | 1 | 210,436 | 0.75 | 1.8% | 0.6% | 19.2% | 0.62 | 0.1% | 13,856 | 6.6% | 6.6 | 25.0% | 8.3% | 19.0% | 3.36 | 58% | 92% | 92% | 7% | 36% | |
|
|
| ||||||
2 | 179,842 | 0.61 | 1.9% | 0.6% | 16.8% | 0.58 | 0.1% | 12,382 | 6.9% | 5.3 | 25.8% | 8.5% | 19.1% | 3.82 | 60% | 92% | 92% | 8% | 46% | |
|
|
| |||||||
3 | 115,475 | 0.75 | 2.2% | 0.7% | 16.6% | 0.52 | 0.1% | 8,874 | 7.7% | 6.2 | 26.2% | 8.6% | 18.4% | 3.07 | 63% | 93% | 94% | 9% | 45% | |
|
|
| |||||||
4 | | | | | | | | | | | | | | | | | | | | |
|
|
| |||||||
5 | | | | | | | | | | | | | | | | | | | | |
|
|
| |||||||
6 | 167,692 | 0.72 | 2.1% | 0.7% | 17.2% | 0.52 | 0.1% | 12,201 | 7.3% | 5.7 | 26.1% | 8.7% | 17.6% | 2.85 | 58% | 90% | 90% | 7% | 40% | |
|
|
| |||||||
7 | 168,791 | 0.64 | 1.9% | 0.6% | 17.1% | 0.41 | 0.1% | 12,161 | 7.2% | 5.1 | 23.6% | 7.8% | 20.3% | 2.44 | 58% | 90% | 91% | 9% | 43% | |
|
|
| |||||||
8 | 168,457 | 0.61 | 1.9% | 0.6% | 15.3% | 0.55 | 0.1% | 10,842 | 6.4% | 5.1 | 26.5% | 8.8% | 16.2% | 3.32 | 54% | 90% | 91% | 7% | 39% | |
|
|
| |||||||
9 | 190,207 | 0.85 | 1.9% | 0.6% | 15.6% | 0.51 | 0.1% | 13,164 | 6.9% | 6.8 | 25.2% | 8.3% | 17.9% | 2.80 | 55% | 92% | 93% | 8% | 38% | |
|
|
| |||||||
10 | 198,951 | 0.87 | 2.1% | 0.7% | 19.0% | 0.59 | 0.1% | 15,411 | 7.7% | 6.2 | 24.4% | 8.1% | 20.0% | 2.94 | 55% | 90% | 92% | 8% | 38% | |
|
|
| |||||||
11 | 117,044 | 0.81 | 2.0% | 0.7% | 18.0% | 0.65 | 0.1% | 8,852 | 7.6% | 5.5 | 24.2% | 8.1% | 20.9% | 3.19 | 52% | 90% | 92% | 9% | 37% | |
|
|
| |||||||
12 | | | | | | | | | | | | | | | | | | | | |
|
|
| |||||||
Total | 9,437,657 | 0.72 | 1.8% | 0.6% | 16.8% | 0.54 | 0.00 | 608,527 | 6.4% | 6.8 | 25.5% | 8.4% | 18.3% | 3.6 | 60.4% | 91.8% | 92.5% | 7.1% | 42.6% | | | | | | | | | | | |
Sum | 270,977 | 1.1 | 2.2% | 0.7% | 21.2% | 0.79 | 0.14% | 16,736 | 7.7% | 12.4 | 27.2% | 9.0% | 21.0% | 5.68 | 68.3% | 94.4% | 95.1% | 9.0% | 52.5% | | | | | | | | | | | |
Max | 115,475 | 0.5 | 1.5% | 0.5% | 14.7% | 0.36 | 0.06% | 8,852 | 5.3% | 4.7 | 23.6% | 7.8% | 15.7% | 2.39 | 51.2% | 88.4% | 89.2% | 5.2% | 32.8% | | | | | | | | | | | |
Min | 209,726 | 0.7 | 1.8% | 0.6% | 16.8% | 0.55 | 0.09% | 13,523 | 6.5% | 6.7 | 25.5% | 8.4% | 18.4% | 3.59 | 60.3% | 91.8% | 92.6% | 7.2% | 42.7% | | | | | | | | | | | |
Median | 212,680 | 0.7 | 1.8% | 0.6% | 16.7% | 0.55 | 0.09% | 13,856 | 6.6% | 6.3 | 25.5% | 8.4% | 18.5% | 3.54 | 59.8% | 91.6% | 92.2% | 7.1% | 41.2% | | | | | | | | | | | |
Source: BVN
SRK Consulting (Peru) S.A. | April, 2022 |
SRK Consulting Peru SA SEC Technical Report Summary – El Brocal | Page 209 |
The monthly average and median for ore throughput are similar at approximately 210,000 tonnes; this is equivalent to 7,000 tonnes/day when assuming 30 days per month. In 2017-2020 minimum and maximum ore throughput show a wide variation at 3,800 tonnes/day and 9,000 tonnes /day respectively, or roughly +29% and -45% of the overall average.
An analysis of throughput versus grinding P80 as seen in Figure 14-4, Figure 14-5, and Table 14-2 suggest some issues and a high degree of operational instability as follows:
· | Over the period in question, the P80 has ranged widely between 111µm and 399µm. This is an unusually large range that strongly suggests issues at the process control level. It is highly unlikely that a mill can efficiently run within such a wide P80 range. |
· | At any given P80, the possible throughput covers an unusually large range. For example, the operational statistics show that at P80=150µm the throughput could range between 894 tonnes/day and 8,490 tonnes/day, which is the equivalent of a relative 109% variability with regards to the overall average of 7,000 tonnes/day previously mentioned. Similar analysis can be done for every other P80 as shown in Table 14-2. |
· | Throughput and grinding P80 over the 2017 to 2020 period (see Figure 14-5) shows that beginning in July 2019 (approximately), the grinding P80 values appear to repeat (or are identical) for multiple consecutive days at a time, which is highly unusual for any processing plant. |
In SRK’s experience, a large variability in fresh feed (ore throughput) typically has a negative impact on plant’s performance, which is included but not limited to the following:
· | Poor grinding efficiency and consequently, an increase in steel consumption for steel balls, ball mill liners as well as accelerated wearing in the classification systems, including slurry pumps. |
· | Instability in the flotation feed stream, which leads to low-quality concentrate and undesirable deportment of metals because cross-contamination of minerals. |
· | Incurring in unnecessary operating expenditures in the way maintenance labor and spare parts. |
· | Additionally, low grade concentrate translates into commercial terms that fall below the industry benchmark and imply unnecessary handling costs when using trucks and/or ocean shipping. |
SRK is of the opinion that it is in El Brocal’s best interests to systematically review its operating practices starting from the ore supply and continuing downstream until reaching concentrate commercial terms. The characterization of the ore supply is required by plant operators to select/apply a suitable set of parameters for that particular ore. Defining a plant’s feed by its head grade only is usually a perfect recipe for a poor metallurgical and cost performance.
Table 14-2: Plant 1, Throughput Variability as Function of Grinding P80
Plant 1 – Throughput, tonnes/day | |||||
|---|---|---|---|---|---|
P80 | Min | Max | Relative variability @7000/td | ||
130 | 3,028 | -57% | 7,831 | 12% | 69% |
140 | 4,345 | -38% | 8,053 | 15% | 53% |
150 | 894 | -87% | 8,490 | 21% | 109% |
160 | 1,487 | -79% | 8,410 | 20% | 99% |
SRK Consulting (Peru) S.A. | April, 2022 |
SRK Consulting Peru SA SEC Technical Report Summary – El Brocal | Page 210 |
Plant 1 – Throughput, tonnes/day | |||||
P80 | Min | Max | Relative variability @7000/td | ||
170 | 7,203 | 3% | 9,308 | 33% | 30% |
180 | 5,839 | -17% | 8,481 | 21% | 38% |
190 | 3,133, | -55% | 8,813 | 26% | 81% |
200 | 7,124 | 2% | 8,704 | 24% | 23% |
210 | 7,548 | 8% | 8,817 | 26% | 18% |
220 | 7,204 | 3% | 9,250 | 32% | 29% |
230 | 7,132 | 2% | 9,628 | 38% | 36% |
240 | 6,181 | -12% | 9,617 | 37% | 49% |
Source: BVN

Figure 14-4: Plant 1, Ore Throughput v/s Grinding P80
Source: BVN

Figure 14-5: Plant 1, Ore Throughput and Grinding P80 v/s time
Source: BVN
An analysis of throughput versus recovery, see Figure 14-6 A/B, suggest that Plant 1’s capacity limit could be approximately 220,000 tonnes/month or 7,300 tonnes/day, which is the value where metals’ recovery to copper concentrate starts trending down.
SRK Consulting (Peru) S.A. | April, 2022 |
SRK Consulting Peru SA SEC Technical Report Summary – El Brocal | Page 211 |

Figure 14-6: Recovery to Concentrate v/s Ore Throughput, Monthly and Daily Basis
Source: BVN
In terms of head grades, Plant 1’s daily copper average shows significant variability from one day to the next, see Figure 14-7. It is SRK’s experience that the daily variability observed is a reflection of a much larger hourly variability, which leads to instability at the plant level that negatively impacts all key performance indicators of a processing facility. The indicators affected may include but are not limited to: higher than necessary expenditure, lower recovery, lower concentrate grade, and undesirable deportment of metals.

Figure 14-7: Head Grade Variability 2018 to 2020
Source: BVN
In terms of Concentrate 1 production, average and median monthly production values are similar and in the range of 13,500 tonnes/month to 13,800 tonnes/month, which is equivalent to between 450 tonnes/day to 460 tonnes/day (approximately) of concentrate production when assuming 30 operating days per month. In 2017-2020, minimum and maximum concentrate production values also reported significant variations at 295 tonnes/day and 558 tonnes/day respectively, which is equivalent to roughly +24% and 35% of the overall average. The equivalent concentrate mass-pull averages 6.45% over the period, and shows a good correlation coefficient (R2=0.91) with ore’s copper head grade as seen in Figure 14-8.
SRK Consulting (Peru) S.A. | April, 2022 |
SRK Consulting Peru SA SEC Technical Report Summary – El Brocal | Page 212 |

Figure 14-8: Concentrate 1 Production versus Copper Head Grade
Source: BVN
In terms of recovery, copper’s monthly values ranged from a minimum of 88.4% to a maximum of 94.4% with a weighted average of 91.8%; the equivalent values for arsenic reached 89.2%, 95.1% and 92.6%; in the case of silver: 51.2%, 68.3% and 60.3%; and for gold: 32.8%, 52.5%, and 42.7%.
Copper Concentrate 1 reached typical commercial values in terms of copper grade but the arsenic grade was unusually high (because of Enargite mineralogy). This is probably limits El Brocal’s ability to sell in the open markets and forces it to deal with concentrate Traders, which typically buy concentrates after levying significant penalties. SRK requested but was denied of the necessary detailed information to properly support the metallurgical parameters required to estimate Reserves & Resources. It is SRK’s opinion that the high content of deleterious elements may translate into a material loss of value for El Brocal’s concentrate. As such, the current estimates of the blocks’ value may not accurately represent future economics.
Plant 2, Lead and Zinc Ore |
Plant 2 is a conventional, sequential multi-stage concentrator that produces lead and zinc concentrates that are trucked offsite to be sold to third parties. The plant’s unit processes include crushing, washing, grinding, and flotation. Final tails are thickened and disposed of in a conventional tailings storage facility. Final concentrates are thickened and dewatered before being trucked off site. A simplified block flow diagram of Plant 2 is shown in Figure 14-9 and the detailed flowsheet is shown in Figure 14-10.
SRK Consulting (Peru) S.A. | April, 2022 |
SRK Consulting Peru SA SEC Technical Report Summary – El Brocal | Page 213 |

Figure 14-9: El Brocal, Plant 2 Simplified Block Flow Diagram
Source: BVN

Figure 14-10: El Brocal, Plant 2 Detailed Flowsheet
Source: BVN
SRK Consulting (Peru) S.A. | April, 2022 |
SRK Consulting Peru SA SEC Technical Report Summary – El Brocal | Page 214 |
Plant 2 – Crushing, Washing & Classification Stage |
Dump trucks deliver material to a coarse ore bin of 300 tonnes capacity equipped with a rock breaker and a stationary grizzly. The grizzly’s passing size directly feeds a roller crusher with 536 hp. The crusher discharge is conveyed to a washing stage consisting of a rotary washing trommel of 3.6 m diameter and 12 m long that discharges onto two doubledeck 10’ x 24’ banana screens operating in series (primary and secondary). Oversize from the primary banana screen feeds a secondary crushing stage operating in open circuit and consisting of a 500 tonnes capacity hopper feeding two parallel gyratory crushers. Discharge from the secondary crushers joins the oversize from the secondary banana screen to feed a tertiary crushing stage consisting of a 400 tonnes hopper feeding a high pressure grinding rolls unit (HPGR). Discharge from the HPGR feeds a single 15’ x 26’ banana screen whose passing stream become final product from the crushing plant that is conveyed to a fines stockpile (overall coarse fraction). The coarse stream from the tertiary banana screen is recirculated back to the tertiary crushing stage.
Passing stream from the secondary banana screen feeds a Four-stage classification plant. The first stage consist of a single primary hydrocyclone whose underflow feeds the secondary classification stage using a multi-deck high frequency vibrating screen. The fines fraction from the primary and secondary stage feed the tertiary stage consisting of 22 hydrocylones. Overflow stream (fines) from the tertiary stage feed the quaternary stage consisting of 16 hydrocyclones. The coarse stream from the secondary stage feeds the fines stockpile. The underflow stream from the tertiary stage feeds primary grinding stage. The underflow from the quaternary stage feeds the fines flotation plant. The overflow stream from the quaternary stage feed a 20 m diameter clarifier whose discharge is split between the fines flotation plants and the ultrafines flotation plant.
Plant 2 – Grinding and Flotation, Coarse Fraction |
The coarse fraction from the washing, crushing and classification stage are stored in a 50,000 tonnes capacity stock pile. Ore is reclaimed from the stockpile using a front-end loader to feed a hopper that subsequenlty feeds the primary grinding stage. The primary grinding stage consists of two ball mills operating in parallel; the first unit is a 9.5’ x 14’ and 600 kW and the second unit is a 20’ x 30’ and 6500 kW. Both ball mills operate in close-circuit with 10 units of a high frequency multi-deck vibrating screen. The passing stream from the classification screens feeds the conditioning tank to the flotation stage.
The 24’ x 24’ conditioning tank receives slurry from the primary grinding stage and feeds the lead rougher flotation cells 1 to 5; its concentrate is transferred to the lead cleaner flotation head tank, and its tails feed a closed-circuit regrinding-classification stage consisting of a 16’ x 22’ and 2800 kW ball mill and 24 x hydrocylones. Overflow stream from the hydrocyclones feeds the rougher flotation cells 6 to 9, whose concentrate feeds the lead cleaner flotation head tank. The concentrate stream from the lead cleaner cells becomes final lead concentrate stream, and its tails stream is recirculated back to rougher cells 1 to 5. Tails from rougher cells 6 to 9 become fresh feed to the zinc flotation circuit.
SRK Consulting (Peru) S.A. | April, 2022 |
SRK Consulting Peru SA SEC Technical Report Summary – El Brocal | Page 215 |
Plant 2 – Lead Concentrate Thickening & Filtration |
The final concentrate stream from the lead flotation circuit is received in a 40’ diameter x 10’ high thickener. Solids discharged from the thickener feed a 2m x 2m and 29 plates filter press. The filtered concentrate is discharged onto a lead concentrate stockpile waiting to be trucked offsite.
A sedimentation pond receives the thickener overflow; its solids are harvested on a regular basis and its clear water overflow is transferred to the tailings storage facility along with tails from the fines flotation circuit and ultrafines flotation circuit.
Plant 2 – Zinc Flotation Circuit |
Tails discharged from the lead rougher flotation cells 6 to 9 become fresh feed for the zinc flotation circuit. The feed is received in a 24’ x 24’ zinc conditioning tank, whose overflow feeds the two rougher flotation banks operating in series with a total of 9 rougher cells. Tails from the zinc rougher cells become final tails, which are transferred to the tails thickener. Concentrate from the zinc rougher cells feeds an inverse regrinding and classification close-circuit consisting of a 9.5’ x 12’ and 520 kW ball mill and hydrocyclones. Overflow from the hydrocyclones feeds the cleaner flotation cells. Concentrate stream from the cleaner flotation cells becomes final zinc concentrate while tails from the cleaner cells are recirculated back to the zinc circuit conditioning head tank.
Plant 2 – Zinc Concentrate Thickening & Filtration |
Final concentrate stream from the zinc flotation circuit is received in an 80’ diameter x 15’ high thickener. Solids discharged from the thickener feed a 2m x 2m and 55 plates filter press. The filtered concentrate is discharged onto a lead concentrate stockpile waiting to be trucked offsite.
A sedimentation pond receives the thickener overflow; its solids are harvested on a regular basis and its clear water overflow is transferred to the tailings storage facility along with tails from the fines flotation circuit and ultrafines flotation circuit.
Plant 2 – Flotation, Fines Fraction |
The underflow stream from the quaternary classification stage, along with a fraction of the ultrafines from the washing plant thickener, feed a 15’ diameter x 16.5’ high conditioning tank. The conditioning tank’s overflow feeds four DR-300 rougher flotation cells, whose tails feed three 15’ diameter x 16.5’ high zinc conditioning tanks. Overflow from the zinc conditioning tanks feed a rougher flotation bank of 12 DR-100 flotation cells, whose tails become final tails that are transferred to tailings storage facility while its concentrate stream is transferred to the zinc cleaner flotation cells bank. Concentrate from the cleaner cells becomes final concentrate that is pumped to the zinc concentrate thickener, and its tails are recirculated back to the zinc rougher flotation DR-300 cells.
SRK Consulting (Peru) S.A. | April, 2022 |
SRK Consulting Peru SA SEC Technical Report Summary – El Brocal | Page 216 |
Plant 2 – Flotation, Ultrafines Fraction |
A fraction of the washing plant thickener underflow stream feeds two 10’ x 10 conditioning tanks. The conditioning tank’s overflow feeds eight DR-300 rougher flotation cells whose tails feed a 20’x 20’ zinc conditioning tank, and its concentrate stream becomes final tails. Overflow from the zinc conditioning tank feed to a rougher flotation bank of 12 DR-100 cells whose tails become final tails that are transferred to tailings storage facility, and its concentrate stream feeds the zinc cleaner flotation cells bank. Concentrate from the cleaner cells become final concentrate that is pumped to the zinc concentrate thickener, and its tails are recirculated back to the zinc rougher flotation DR-300 cells.
Plant 2 – Operational Performance |
El Brocal’s Plant 2 operational results for the 2017 to 2020 period are presented on an annual basis in Table 14-3.
Ore throughput has consistently ranged from 3.1 million to 3.7 million tonnes per year but dropped to 2.8 million tonnes per year in 2020. Ore head grades have been reasonably consistent within the period in question: silver ranged from 1.0 oz/t to 1.3 oz/t; lead, from approximately 1% to 1.14%; zinc from 2.1% to 3.3%; and iron content from approximately 16% to 18%.
Plant 2’s monthly average reached 277,667 tonnes equivalent to a daily average of 9,256 tonnes when assuming 30 days per month. The 2017 to 2020 minimum and maximum ore throughput shows a large difference of 156,753 tonnes/month and 365,998 tonnes/month respectively, or roughly -44% and +32% of the overall average, which translates into 76% relative variability in throughput.
An analysis of throughput versus grinding P80 as seen in Figure 14-11 and Table 14-4 suggest a high degree of operational instability as follows:
| ● | Over the period in question, the P80 has ranged widely between 10µm and 294µm. Similarly the situation at Plant 1, this is an unusually large range that strongly suggests issues at the process control level. It would be highly unusual for a mill to efficiently operate within such a wide P80 range. |
| ● | At any given P80, the possible throughput covers an unusually large range. For example, the operational statistics show that at P80=160µm, the throughput could range between 1,029 tonnes/day and 13,171 tonnes/day, which is equivalent to 131% relative variability with regard to the overall average of 9,256 tonnes/day previously mentioned. A similar analysis can be conducted for every other P80 as shown in Table 14-4. |
SRK Consulting (Peru) S.A. | April, 2022 |
SRK Consulting Peru SA SEC Technical Report Summary – El Brocal | Page 217 |
Table 14-3: El Brocal, Plant 2 – Overall Operational Results 2017 – 2020
Units | 2017 | 2018 | 2019 | 2020 | Total | |
Fresh ore | tonnes | 3,126,616 | 3,712,511 | 3,714,615 | 2,774,251 | 13,327,994 |
Ag oz/t | 1.30 | 1.04 | 1.24 | 1.23 | 1.20 | |
Pb% | 1.13% | 1.03% | 1.14% | 1.07% | 1.09% | |
Zn% | 2.7% | 2.1% | 2.2% | 3.3% | 2.5% | |
Fe% | 17.5% | 15.8% | 16.1% | 17.9% | 16.7% | |
Concentrate Pb | tonnes | 41,435 | 42,584 | 53,448 | 36,718 | 174,185 |
Ag oz/t | 46.21 | 38.73 | 37.25 | 36.98 | 39.68 | |
Pb% | 48.8% | 49.4% | 47.5% | 47.1% | 48.2% | |
Zn% | 6.3% | 6.5% | 7.4% | 7.7% | 7.0% | |
Fe% | 7.8% | 7.3% | 7.4% | 8.3% | 7.7% | |
Rec Ag | 47.2% | 42.8% | 43.1% | 39.8% | 43.4% | |
Rec Pb | 57.3% | 55.3% | 59.8% | 58.0% | 57.6% | |
Rec Zn | 3.1% | 3.6% | 4.8% | 3.1% | 3.6% | |
Rec Fe | 0.6% | 0.5% | 0.7% | 0.6% | 0.6% | |
Mass pull | 1.3% | 1.1% | 1.4% | 1.3% | 1.3% | |
Concentrate Zn | tonnes | 97,527 | 90,161 | 91,384 | 102,056 | 381,128 |
Ag oz/t | 10.45 | 10.20 | 12.91 | 8.32 | 10.41 | |
Pb% | 3.6% | 3.9% | 3.9% | 2.9% | 3.6% | |
Zn% | 49.7% | 49.5% | 49.3% | 49.2% | 49.4% | |
Fe% | 5.7% | 5.4% | 5.2% | 6.1% | 5.6% | |
Rec Ag | 25.1% | 23.9% | 25.6% | 24.9% | 24.9% | |
Rec Pb | 10.1% | 9.3% | 8.4% | 10.0% | 9.4% | |
Rec Zn | 58.1% | 58.0% | 54.7% | 55.3% | 56.5% | |
Rec Fe | 1.02% | 0.84% | 0.80% | 1.3% | 1.0% | |
Mass pull | 3.1% | 2.4% | 2.5% | 3.7% | 2.9% | |
Concentrate Total | tonnes | 138,961 | 132,745 | 144,832 | 138,774 | 555,313 |
Ag oz/t | 21.11 | 19.35 | 21.89 | 15.90 | 19.59 | |
Pb% | 17.1% | 18.5% | 20.0% | 14.6% | 17.6% | |
Zn% | 36.8% | 35.7% | 33.8% | 38.2% | 36.1% | |
Fe% | 6.4% | 6.0% | 6.0% | 6.7% | 6.3% | |
Rec Ag | 72.3% | 66.7% | 68.7% | 64.7% | 68.3% | |
Rec Pb | 67.4% | 64.6% | 68.1% | 67.9% | 67.0% | |
Rec Zn | 61.2% | 61.6% | 59.5% | 58.5% | 60.1% | |
Rec Fe | 1.6% | 1.4% | 1.5% | 1.9% | 1.6% | |
Mass pull | 4.4% | 3.6% | 3.9% | 5.0% | 4.2% |
Source: BVN
SRK Consulting (Peru) S.A. | April, 2022 |
SRK Consulting Peru SA SEC Technical Report Summary – El Brocal | Page 218 |
Table 14-4: Plant 2, Throughput Variability v/s Grinding P80
Plant 2 – Throughput, tonnes/day | |||||
P80 | Min | Max | Relative Variability | ||
130 | 0 | 0% | 0 | 0% | 0% |
140 | 9,506 | 3% | 13,559 | 46% | 44% |
150 | 3,087 | -67% | 13.872 | 50% | 117% |
160 | 1,029 | -89% | 13,171 | 42% | 131% |
170 | 1,086 | -88% | 13,371 | 44% | 133% |
180 | 5,519 | -40% | 12,967 | 40% | 80% |
190 | 4,186 | -55% | 13,527 | 46% | 101% |
200 | 7,214 | -22% | 11,864 | 28% | 50% |
210 | 4,545 | -51% | 13,742 | 48% | 99% |
220 | 9,921, | 7% | 12,896 | 39% | 32% |
230 | 0 | 0% | 0 | 0% | 0% |
240 | 9,391 | 1%0 | 9,688 | 5%. | 3% |
Source: BVN

Figure 14-11: Plant 2, Ore Throughput v/s Grinding P80
Source: BVN
Figure 14-13 shows throughput and grinding P80 over the 2017 to 2020 period, which shows that starting around July 2019, the reported grinding P80 values seems to repeat (or are identical) for multiple consecutive days at a time. This performance is highly unusual for any processing plant and deserves El Brocal’s full attention. Figure 14-12 confirms significant variability for P80, and more critically, indicates that on 80% of the days, the primary grinding P80 ranged between 120 µm and 200 µm.
SRK Consulting (Peru) S.A. | April, 2022 |
SRK Consulting Peru SA SEC Technical Report Summary – El Brocal | Page 219 |

Figure 14-12: Plant 2, Grinding P80 Frequency Distribution
Source: BVN
Figure 14-13: Plant 2, Ore Throughput & Grinding P80 v/s Time
Source: BVN
In terms of lead concentrate, an analysis of relationships between lead recovery and other key indicators for Plant 2 are shown in Figure 14-14, Figure 14-15, and Figure 14-16. The following observations can be made:
· | Silver recovery reaches a correlation coefficient of R2= 0.79; lead’s head grade suggests a strong degree of association between both metals. |
· | Recovery of zinc to lead concentrate also presents a high correlation coefficient with lead recovery, which more than likely translated into penalties at 7% Zn grade average in the 2017-2020 period. Mineral associations, and consequently liberation size (P80) and flotation conditions, are typically responsible for the cross contamination of concentrate. Additionally, Plant 2’s regrind stage, along with its downstream rougher flotation, appears to be critical to liberate and separate lead from zinc. |
SRK Consulting (Peru) S.A. | April, 2022 |
SRK Consulting Peru SA SEC Technical Report Summary – El Brocal | Page 220 |
· | The correlations v/s P80 suggest rather poor relationships with recoveries and concentrate grades, which coupled with the previous observation about the large variability in throughput v/s P80, strongly suggests that if El Brocal expects to improve its metallurgical performance, it needs to seriously review all process control practices and potentially incorporate adjustments in its flowsheet. The key aspects that require attention include deportment of metals in the multiple flotation stages; tighter control of the product particle size off the primary grinding; and re-grinding ball mills. |
· | Lead recovery exhibits a correlation coefficient of R2=0.69 with lead’s head grade. |

Figure 14-14: Plant 2, Key Metallurgical Relationships
Source: BVN
Figure 14-15: Plant 2, Recovery v/s P80
Source: BVN
SRK Consulting (Peru) S.A. | April, 2022 |
SRK Consulting Peru SA SEC Technical Report Summary – El Brocal | Page 221 |

Figure 14-16: Plant 2, Concentrates Grade v/s P80
Source: BVN
An additional look at the relationship between concentrate mass pull; metal to recovery to concentrates; and concentrates grades is presented in Figure 14-15 and 14-16, the following observations ca be made:
· | Recovery to lead concentrate shows a strong relationship with mass pull as expressed by their correlation coefficients of R2= 0.73 for silver, R2= 0.73 for lead, and R2= 0.69 for zinc. |
· | Similarly, lead concentrate grades are highly correlated to mass pull and show correlation coefficients of R2= 0.4, R2= 0. 46, and R2= 0.41 respectively. These facts, coupled with the previous analysis for Figures 14-12 to Figure 14-14, strongly suggests that Plant 2’s actual operating criteria is mainly focused on mass pull and that limited attention is paid to the liberation size and selectivity. |
Conclusions & Recommendations |
· | Mined ore is re-handled multiple times before being delivered to the mill. In SRK’s opinion, there are no technical reasons to support rehandling. Apparently, this takes reflects a social commitment with surrounding communities. Additional and unnecessary expenditure is a clear outcome from this practice. |
· | During the visit to El Brocal facilities, SRK observed a highly unusual and unnecessary number of operators for a maintenance job on a small rod mill. The explanation given to SRK was that the number of operators was directly associated with contractual obligations with the union. |
· | Both Plant 1 and Plant 2 show a high degree of variability in their key performance indicators, which includes tonnes per day (and tonnes per hour) of fresh feed and grinding P80. An unstable mill feed is usually a driver of low recovery and poor-quality concentrates. The mill´s mechanical availability appears to be driven by regular malfunctioning or upsets mostly from ancillary systems like conveyor and chutes, and not from major process equipment problems. |
· | Process automation, although present, is not operating to the standards required. An online metal assaying system for flotation was not working at the time of the visit, and apparently haven’t operated for a long time. Typically, unless the operating workforce is well experienced and has a positive attitude towards continuous improvement, the only |
SRK Consulting (Peru) S.A. | April, 2022 |
SRK Consulting Peru SA SEC Technical Report Summary – El Brocal | Page 222 |
tools to maintain and improve metallurgical performance is to measure the key variables and then work towards improvement.
· | In SRK’s opinion, the absence of a system to integrate geological, mining, metallurgical, and commercial data in a suitable geometallurgical model is negatively impacting El Brocal’s bottom line. The processing plant will perform at its maximum when fresh feed is within expected parameters for lithology, mineralogy, alteration and grades. At this in time, El Brocal seems to consider only parameters for grade. Additional mechanical issues at the plant are also taking a toll. |
· | SRK is also of the opinion that given El Brocal’s potentially long mine life, efforts to modernize the flowsheet, particularly for the crushing-grinding stages, should be assessed. Currently, the use of small capacity rod mills followed by ball mills is clearly demanding large operating and maintenance crews and driving low mechanical availability, which jacks up operating expenditures. |
SRK Consulting (Peru) S.A. | April, 2022 |
SRK Consulting Peru SA SEC Technical Report Summary – El Brocal | Page 223 |
Infrastructure |
15.1Waste Rock Management Facility
The Condorcayan waste rock management facility is located towards the northern area of the Mercedes Norte pit, at an approximate distance of 300 m. Figure 15-1 shows the plan location of the deposit and pit.
The feasibility design was developed in 2008 by DCR Ingenieros. It considered an extension of 205 Ha for a storage volume of 135.7 Mm³ or 240 Mt and an estimated density of 1.8 t/m³ of dumped waste rock. This storage capacity would cover the life of mine forecasts, which for that year contemplated a production of 110 Mt of waste rock over a period of 10 years.
The facility design contemplates 12 m high benches with 35° slopes, and a berm width of 15.6 m. Geometry establishes an overall slope of 21° with a total height of 165 m, reaching the maximum storage level at 4,486 MASL.
During this study, geological and geotechnical investigations were carried out to define the foundation materials and characterize the waste rock. As part of drilling activities, glacial deposits with a high content of plastic clays were identified, which would be part of the facility foundation, in addition to the bedrock, which showed signs of significant alterations.
Although the stability analyses indicated that the proposed design criteria have been met, said criteria needs to be defined more rigorously according to the risk of the structure. Investigation needs to be expanded to contemplate future phases. Additionally, SRK recommends complementing the analyses by focusing on the consequences of foundation failure relative to the recharge height of the facility and the undrained behavior of the clay foundation; it will also be necessary to determine if the facility’s interaction with the pit follows parameters for physical security.
Regarding the geochemical evaluation of waste rock, it has been characterized as a non-acid generating material; however, research on this point has been limited and should be expanded in future studies with a larger number of static and kinetic tests.
In addition, the design contemplates surface runoff diversion works through the construction of diversion dikes, canals, and spillways. The design event for surface water diversion works contemplated a maximum of 24-hours of rainfall for a return period of 500 years.
SRK Consulting (Peru) S.A. | April, 2022 |
SRK Consulting Peru SA SEC Technical Report Summary – El Brocal | Page 224 |

Figure 15-1: Condorcayan waste Dump
Source: BVN
Tailings Management Facility |
Huachuacaja tailings management facility and ancillary facilities |
General Description
The tailings management facility is located in Huachuacaja Creek. Its maximum capacity to contain the tailings generated at the Huaraucaca Concentrator Plant (located 2 km from the facility) contemplates average ore production rate of 18,000 tpd; the tailings to be deposited will come from lead-zinc (13,500 tpd) and copper-arsenic (4,500 tpd) processes.
SRK Consulting (Peru) S.A. | April, 2022 |
SRK Consulting Peru SA SEC Technical Report Summary – El Brocal | Page 225 |
The area has been studied since 1999 as a potential tailings deposition area, with pre-feasibility and feasibility studies conducted by Klohn Crippen (1999), Knight Piesold (2001), AMEC (2007-2009), GWI (2007-2010), and Golder (2009-2010). The detailed engineering of Huachuacaja tailings management facility was performed by Golder (2012).
Construction of the first stage of the Huachuacaja talilings dam (elevation 4157.5 MASL) was built in 2012 an completed in August 2013. Huachuacaja tailings management facility started operations in 2014.
Currently, the Huachuacaja tailings dam is constructed up to Stage 3 (elev. 4167.5 MASL), storing approximately 42 Mt of tailings, with an average beach slope of 0.5%, with a pond volume of 0.65 Mm³. Based on the design, up to Stage 8 (elevation 4197.5 MASL), it is estimated that a maximum tailings storage capacity of 266 Mt accumulated will be reached, considering an average dry tailings density of 1.59 t/m³.
The facilities considered for the Huachuacaja tailings management facility are:
· | Tailings dam built with soil and rock quarry material, and non-acid generating mine waste rock. This dam considered the average excavation of 4 m of organic material and its replacement with coarse rockfill material (Type 3 and Type 3A material). The upstream slope of the dam has been constructed and will be heightened using low permeability soils (Type 1 and Type 4A material) and includes an HDPE geomembrane to minimize seepage through the tailings dam. The downstream slope has been constructed and will be heightened with mine waste material from the north pit (Type 4 material) and borrow material quarries (Type 4). A transition material (Material Type 2) has been considered between Material Type 3 and Type 4. |
The Huachuacaja dam has installed geotechnical instrumentation consisting of electric piezometers (24), settlement cells (6), accelerometers (1) and topographic control milestones (13).
· | Seepage collection pond and groundwater quality monitoring wells to collect seepage from the tailings management facility, which exit at the foot of Huachuacaja dam. It is located at the downstream foot of Huachuacaja dam and has a seepage collection capacity of about 10 l/s for 6 hours. The seepage collection pond has a pumping system with a capacity of 10 l/s to the Huachuacaja tailings management facility. If the quality of the collected water is Class III (according to DGA-MEM standards), the water will be discharged directly to the Huachuacaja creek. Downstream and upstream of the seepage collection pond, a 50 m deep monitoring well has been considered for groundwater quality monitoring and water level measurements. |
· | Perimeter surface water diversion channels to the Huachuacaja tailings management facility. Two channels called East Perimeter Channel and West Perimeter Channel of 5.9 and 2.6 km in length, respectively, have been constructed. These channels, which are trapezoidal in shape and have a minimum slope of 0.5%, will be lined with masonry and will collect natural water from a basin area of 6.7 km², which is 40% of the total basin area of the tailings management facility. These hydraulic works will reduce rainwater that may flow into the |
SRK Consulting (Peru) S.A. | April, 2022 |
SRK Consulting Peru SA SEC Technical Report Summary – El Brocal | Page 226 |
tailings management facility and will return natural surface water downstream of the tailings management facility.
· | Slurry tailings haulage system from the Huaraucaca Concentrator Plant (Plant 1) to the Tailings Thickening Plant, by means of a 650 m long 18" SDR 9 HDPE piping pump system. From the new Concentrator Plant (Plant 2), the slurry tailings will be conveyed to the Tailings Thickening Plant through a 500 m long pumping line made of 28” SDR 11 HDPE pipeline. The average elevation of both concentrator plants is 4200 MASL and the elevation of the Tailings Thickening Plant will be 4250 MASL. There is also a slime pumping system (discontinuous operation), generated by the fine fraction of both plants (Plant 1 and 2), which reaches a metal box called Box 11, located in the thickening plant, from where the slime is pumped to the Huachuacaja tailings management facility through a 22" SDR 17 HDPE pipe. |
· | Tailings thickening plant consisting of one (1) Westech HCT (High Compression Thickener) type thickener with a 40 m diameter and 6.5 m wall height. Slurry tailings with a solids content between 24 to 26% from the two Concentrator Plants enter the thickener and leave with a solids content between 54 to 56%. The Tailings Thickening Plant is located 500 m north-northwest of the Huaraucaca Concentrator Plant, at an elevation of 4250 MASL, from which tailings (thickener underflow) are sent to the Huachuacaja tailings management facility. The overflow water, with NTU content between 18 to 60 and average of 40, is sent to Box 11, Pb/Zn washing plant, and flocculant dilution water tank. |
· | Thickened tailings distribution system from the tailings Thickening Plant to the Huachuacaja tailings management facility. The system consists of two (2) pump trains (three centrifugal pumps installed in series), called Train 5, consisting of three 8" x 6" Warman pumps; and Train 6, consisting of one 10" x 8" Warman pump and two 8"x6" GIW pumps, which pump the tailings through a 12" ASTM A53 SCH 80 steel pipe, which reaches a bifurcation point in the tailings management facility area, from which the tailings are diverted to two discharge sectors, called the South sector and West sector. The South sector, which passes through the crest of Huachuacaja dam, has a length of 1 km and the western sector, which corresponds to the right bank of the tailings management facility, has a length of 5 km. Each discharge sector is considered to have 8" SDR 11 HDPE discharge pipes every 200 m to the final distribution points, controlled by valves. |
· | Emergency slurry tailings pumping and conveyance system from the tailings Thickening Plant to the west slope of the tailings management facility, adjacent to the Huachuacaja dam. The emergency tailings pipeline will operate, when required, through a bypass of the thickener and will be activated when the thickener or the thickened tailings pumping system is not operating due to maintenance or technical failure. The pumping of slurry tailings from this emergency system will be by centrifugal pumps. This 22" SDR 17 HDPE emergency line consists of three sections of different diameters, comprising 0.7 km of 16", 0.9 km of 14", and 0.3 km of 12". |
· | Water recirculation system from the tailings management facility pond to the reclaimed water tank. This recirculation system is designed to pump 134 l/s from a barge to a booster station and from there by pumping (centrifuges) to the process water Collection Tank located adjacent to the Tailings Thickening Plant, through a 12" SDR 11 HDPE pipe. The total length |
SRK Consulting (Peru) S.A. | April, 2022 |
SRK Consulting Peru SA SEC Technical Report Summary – El Brocal | Page 227 |
of the water recirculation piping is variable depending on the location of the tailings management facility. During the first four (4) years of operation, the pumping length is approx. 2.9 km. The booster station will have two (2) different locations, the first at 1 km from the tailings dam and at 4220 MASL; the second location will be 2.5 km from the tailings dam and at 4225 MASL.
· | Excess water recirculation system from the tailings management facility pond to the WWTPi. Excess water from the tailings pond is sent to the industrial wastewater treatment plant (WWTPi), where it is conditioned to reduce its metal content and control its pH. The feed system to the WWTPi consists of two (2) centrifugal pumps of 100 HP each, installed on a barge, which send the water (500 to 600 m³/h) through a 16" HDPE pipe to a distribution box. The sludge generated at the WWTPi is sent to the tailings management facility through a 200 m³/h capacity pump. |
· | Tailings Desulfurization Plant, which is designed to treat 100% of tailings from the 18 ktpd processing, functions by removing sulfides from the tailings so that the tailings that are deposited are not potentially acid-generating. The sulfides that are removed, which constitute about 14% of the total tailings, will be deposited underwater in the Huachuacaja tailings management facility. This plant would start operating during the last three (3) years of operation, as part of the tailings management facility closure plan. |
Studies Performed
The Huachuacaja area has been studied since 1999 as a potential tailings deposition area, with Pre-feasibility, Feasibility, and Detailed Engineering studies conducted by:
· | Klohn Crippen (2000). Klohn Crippen - SVS Ingenieros Consultores (KC-SVS). Huachuacaja Dam and Pond - Final Report and Plans. April 2000. |
· | Knight Piesold (2001). Knight Piesold Consultores S.A. (KP). Final Study for the Construction of the Huachuacaja Tailings Dam. Final Study Report. April 2001. |
· | AMEC (2008). AMEC, 2008. Geotechnical Investigations of El Brocal Feasibility Study, Cerro de Pasco-Peru. Prepared for SMEB. August 2008. |
· | BCG (2009). BGC Engineering Inc. Screening Level for Tailings Management Facilities (TMF) - SMEB Huachuacaja Dam TMF for 130 M-t Tailings Capacity – Alternate Conceptual Designs. Prepared for SMEB. May 2009 |
· | Ground Water International (2008). |
o | (GWI), 2008a. Comprehensive Hydrogeological Study of the Colquijirca Mine. Final Report. December 2008. |
o | GWI, 2008b. Hydrogeological Investigation of the Marcapunta Oeste Cavern, Colquijirca Mine. Prepared for SMEB. |
· | SVS Ingenieros S.A.C. Pre-Feasibility Study for the Huachuacaja Tailings Management Facility. Prepared for SMEB. June 2009. |
· | Golder (2010). |
SRK Consulting (Peru) S.A. | April, 2022 |
SRK Consulting Peru SA SEC Technical Report Summary – El Brocal | Page 228 |
o | Golder, 2010a. Geological Evaluation of the Tailings Management Facility Area. Basic Engineering Study of the Huachuacaja Tailings Management Facility. Prepared for Sociedad Minera El Brocal. September 2010. |
o | Golder 2010b. Seismic Hazard Assessment of the Project Area. Basic Engineering Study of the Huachuacaja Tailings Management Facility. Prepared for SMEB. September 2010. |
o | Golder 2010c. Hydrology of the Huachuacaja Tailings Management Facility Area. Basic Engineering of the Huachuacaja Tailings Management Facility. Prepared for Sociedad Minera El Brocal. September 2010. |
o | Golder, 2010d. Tailings Water Quality - Mine Coal and Slag Liabilities. Basic Engineering Study of the Huachuacaja Tailings Management Facility. Prepared for Sociedad Minera El Brocal. September 2010. |
o | Golder, 2010e. Geochemical Characterization of Liabilities, Tailings, and Borrow Materials for the Dam. Basic Engineering Study of the Huachuacaja Tailings Management Facility. Prepared for Sociedad Minera El Brocal. September 2010. |
o | Golder, 2010f. Hydrogeological Evaluation of the Tailings Management Facility Area. Basic Engineering Study of the Huachuacaja Tailings Management Facility. Prepared for Sociedad Minera El Brocal. September 2010. |
o | Golder, 2010g. Geotechnical Assessment. Basic Engineering Study of the Huachuacaja Tailings Management Facility. Prepared for Sociedad Minera El Brocal. September 2010. |
o | Golder 2010h. Huachuacaja Tailings Rheology. Basic Engineering of the Huachuacaja Tailings Management Facility. Prepared for Sociedad Minera El Brocal. September 2010. |
o | Golder 2010i. Water Balance of the Huachuacaja Tailings Management Facility of Colquijirca Mine. Basic Engineering of the Huachuacaja Tailings Management Facility. Prepared for Sociedad Minera El Brocal. September 2010. |
o | Golder 2010j. Stability Analysis of the Huachuacaja Tailings Dam of Colquijirca Mine. Basic Engineering of the Huachuacaja Tailings Management Facility. Prepared for Sociedad Minera El Brocal. September 2010. |
o | Golder 2010k. Seepage Analysis of the Huachuacaja Tailings Dam of Colquijirca Mine. Basic Engineering of the Huachuacaja Tailings Management Facility. Prepared for Sociedad Minera El Brocal. September 2010. |
· | Golder (2011). |
o | Golder 2011a. Soils Study for Major Equipment Foundation Purposes - Detailed Engineering of Huachuacaja Tailings Management Facility. Prepared for Sociedad Minera El Brocal. February 2011. |
o | Golder 2011b. Detailed Thickened Tailings Deposition Plan. Detailed Engineering of Huachuacaja Tailings Management Facility. Prepared for Sociedad Minera El Brocal. February 2011. |
o | Golder 2011c. Deformation Evaluation of Huachuacaja Dam under Static and Dynamic Conditions. Detailed Engineering of Huachuacaja Tailings Management Facility. Prepared for Sociedad Minera El Brocal. February 2011. |
o | Golder 2011d. Closure Plan for Coal and Slag Liabilities in the Huachuacaja creek area. Detailed Engineering of Huachuacaja Tailings Management Facility. Prepared for Sociedad Minera El Brocal. March 2011. |
SRK Consulting (Peru) S.A. | April, 2022 |
SRK Consulting Peru SA SEC Technical Report Summary – El Brocal | Page 229 |
o | Golder, 2011e. Planning for the Procurement of Construction Materials for the Huachuacaja Tailings Dam. Prepared for Sociedad Minera El Brocal. March 2011. |
o | Golder 2011f. Operation Manual of the Huachuacaja Tailings Management Facility of Colquijirca Mine. Detailed Engineering of Huachuacaja Tailings Management Facility. Prepared for Sociedad Minera El Brocal. April 2011. |
o | Golder 2011g. Design of Dump for Material Unsuitable for Construction. Detailed Engineering of Huachuacaja Tailings Management Facility. Prepared for Sociedad Minera El Brocal. April 2011. |
· | Golder (2012). |
o | Golder 2012a. North Pit Mining Plan for Obtaining Rockfill Material - Tailings Dam Construction. Detailed Engineering of Huachuacaja Tailings Management Facility. Prepared for Sociedad Minera El Brocal. May 2012 |
o | Golder 2012b. Water Balance of the Huachuacaja Tailings Management Facility. Detailed Engineering of Huachuacaja Tailings Management Facility. Prepared for Sociedad Minera El Brocal. May 2012 |
o | Golder 2012c. Detailed Engineering of Huachuacaja Tailings Management Facility. Report version 4. Prepared for Sociedad Minera El Brocal. May 2012 |
· | Golder (2021). Technical File Update Project for the amended EIA - DRH. Final Report. Update of Technical File for the MEIA of Huachuacaja Tailings Management Facility. Sociedad Minera El Brocal S.A.A. Report No. 5800001952-300-00-ITE-0001_Rev1. September 30, 2021. |
Field Investigation Performed
The geotechnical investigations carried out in the area of the Huachuacaja tailings management facility were executed through several campaigns between 2000 and 2020. The primary purpose was to characterize the foundation ground for the project's main components and/or study the quarries. The summary of geotechnical field investigation carried out is shown in Table 15-1.
SRK Consulting (Peru) S.A. | April, 2022 |
SRK Consulting Peru SA SEC Technical Report Summary – El Brocal | Page 230 |
Table 15-1: Summary of Geotechnical Investigation
Area | Study | Test Pits/ | Diamond drillings | Permeability | SPT/ | DPL | CPTu | MASW/ | Seismic refraction (m) |
Vaso and Huachuacaja Dam | Lara Consulting (2019) | - | 4 | 70 | 28/25 | - | 4 | 12 | - |
Golder (2010) | 6 | 12 | 131 | 111 | - | 6 | 8 | 2880 | |
Amec (2008) | - | 21 | 45 | - | - | - | - | - | |
Knight Piésold (2001) | - | 7 | 49 | - | - | - | - | - | |
Klohn Crippen – SVS (2000) | 10 | 5 | 17 | - | - | - | - | - | |
SVS (2009) | - | - | - | - | - | - | - | 600 | |
Golder (2010) | 4 | - | - | - | - | - | - | - | |
Diversion Channel | Golder (2010) | 20 | - | - | - | 8 | - | - | - |
Seepage collection pond | Golder (2010) | 5 | - | - | - | 6 | - | - | - |
Quarries | Golder (2010) | 45 | 1 | 9 | 13 | - | - | - | - |
Golder (2015) | 11 | - | - | - | - | - | - | - | |
Golder (2018) | 5 | - | - | - | - | - | - | - | |
Coal and slag Liabilities | Golder (2010) | 22 | 2 | 9 | 10 | - | - | - | 1080 |
Total | | 128 | 52 | 330 | | 25 | - | - | 3960 |
Source: Golder
SRK Consulting (Peru) S. A. | April, 2022 |
SRK Consulting Peru SA SEC Technical Report Summary – El Brocal | Page 231 |
Capacity of the Tailings Management Facility
The Huachuacaja tailings management facility has been designed to be heightened in eight stages, which correspond to: Stage 1 (4157.5 MASL), Stage 2 (4161.5 MASL), Stage 3 (4167.5 MASL), Stage 4 (4173.5 MASL), Stage 5 (4178.5 MASL), Stage 6 (4184.5 MASL), Stage 7 (4193.5 MASL), and Stage 8 (4197.5 MASL). Heightening is currently up to Stage 3, having stored 42 Mt of tailings and it is estimated that it can store an accumulated volume of 86 Mt up to Stage 4; 116 Mt up to Stage 5; 164 Mt up to Stage 6; 242 Mt up to Stage 7; and 266 Mt up to Stage 8 and considers the formation of a tailings beach of 0. 5%; a freeboard of 5 m; an operational pond volume of 1.0 Mm³; and a probable maximum flood (PMF) volume of 3.8 Mm³, corresponding to a probable maximum of 24-hour rainfall of 229 mm. The average dry density of the deposited tailings will be 1.59 t/m³.
Tailings Management Facility Heightening Strategy
The main tailings management facility design criteria are:
· | Deposition of tailings from the ore process. |
· | Heightening of dam in stages using the downstream method to favor the gradual dissipation of pore pressure. |
· | As part of the Huachuacaja dam foundation, a platform and compacted low permeability material has been placed to the upstream foot and slope face, on which a liner has been installed to mitigate deformations in the early operation stage and flows through the dam body. |
· | Move the tailings management facility pond away from the western slope of the tailings management facility where there is evidence of karst zones and fault alignments, both likely pathways for seepage outside the tailings management facility area. |
· | Move the tailings management facility pond away from the tailings dam to minimize risks of tailings dam instability. |
· | Flexible management of the recovery system for water from the tailings management facility pond. |
· | Inhibit tailings oxidation to minimize the risk of acid generation from the tailings. |
· | The tailings deposited will be the closure cover for the existing coal and slag liabilities on the east slope of the Huachuacaja creek. |
· | Facilitate closure of the tailings management facility. |
Construction QA/QC procedures, results, and additional controls
Each construction stage will be supported by a Quality Dossier report, which provides relevant information on the construction process and describes work quality management. It is developed based on the plans and technical specifications of each of the tailings management facility’s components. The report will contain graphic reports (as-built plans, photographic records) and documentation of laboratory tests that validate the work performed, as well as quality management documents, such as: request for information (RFI), design change request (DCR), field instructions (FI), surveillance reports (SVR) and non-conformities (NCR).
SRK Consulting (Peru) S. A. | April, 2022 |
SRK Consulting Peru SA SEC Technical Report Summary – El Brocal | Page 232 |
The tailings management facility dam is currently constructed to Stage 3. Plans and technical specifications have been followed and design changes and field instructions have been implemented, as endorsed in the Quality Dossier report.
Heightening Phases
Currently, the Huachuacaja tailings management facility is constructed to Stage 3, with future heightening estimated to be as shown in Table 15-2.
Table 15-2: Huachuacaja Tailings Management Facility Heightening Schedule.
Stage | Start of construction | End of construction |
|---|---|---|
4 (Phase 1 and 2) | March 2022 | November 2022 |
4 (Phase 3) | February 2023 | November 2023 |
5 | July 2025 | May 2027 |
6 | July 2028 | August 2030 |
7 | June 2037 | June 2038 |
8 | March 2048 | March 2049 |
Source: Golder
Tailings Characteristics
The mineralized zone is characterized by the existence of iron sulfides (pyrite), copper (Tennantite), lead (galena), and zinc (sphalerite), with gangue minerals such as quartz, clays such as alunite, illite, and kaolinite, iron oxides and carbonates such as dolomite and siderite. The Cu-As tailings have a pyrite content of 36%, 5 times higher than that of Pb-Zn. The quartz content of Cu-As tailings is 47% and is 2 times higher than that of Pb-Zn. The iron oxide content of Pb-Zn tailings is 18% and is 30 times higher than that of Cu-As.
The tailings are the size of silts with sands. The sand content is 18% and fines content is 82%. The clay content and specific gravity of mixed tailings are 18% and 3.17, respectively.
From the laboratory results, the following can be stated:
· | The expected average permeability range for the thickened tailings deposited is in the order of 2x10⁸m/s to 8x10⁻⁹ m/s, with a mean value of 1x10⁻⁸ m/s. |
· | The average void ratio of the deposited tailings is in the order of 0.9 to 1.0, considering an average height of 20 m of deposited tailings. |
Regarding tailings rheology, for a solids content of 60 to 70%, the unsheared yield stress of Huachuacaja tailings is 60 to 90 Pa. In order to have thickened tailings with sufficient fluidity, the target thickening of 62% solids content is estimated to be adequate for the specific case of tailings deposition at Huachuacaja, where the focus, rather than maximizing deposition slopes, is on obtaining a low segregable tailings mass with low permeability that flows after being discharged into the tailings management facility.
SRK Consulting (Peru) S. A. | April, 2022 |
SRK Consulting Peru SA SEC Technical Report Summary – El Brocal | Page 233 |
Main Design Considerations
The tailings dam is considered as a zoned dam built with rockfill material, moraine soil, and non-acid generating mine waste rock from the north pit.
· | Waterproofing of the upstream slope by means of a low permeability soil cover with a minimum thickness of 10 m, on which a 1.5 mm HDPE geomembrane will be placed. This waterproofing system is intended to minimize seepage through the tailings dam. |
· | Geotechnical instrumentation of the dam. It will consist of the installation of fiber optic piezometers, settlement cells, and an accelerograph. This instrumentation is intended to measure pore pressure; deformations of the dam and its foundation; and seismic records. The purpose of all of the aforementioned is to monitor the dam's behavior. |
The tailings dam considers a foundation treatment consisting of:
· | Excavation of peat and superficial organic material, in an average thickness of 4 m in the entire foundation area of the dam, at the bottom of the valley. This excavation will be performed at the beginning of the dam Stage 1 construction (elevation 4207 MASL). |
· | For the closure of the tailings management facility, a foundation treatment using gravel columns and the construction of a toe berm has been considered. Whether or not to apply this foundation treatment will depend on what is reported by the geotechnical instrumentation monitoring and SPT tests to verify the improvement of the foundation soil strength and to be performed during the fourth (4) year of the tailings management facility operation. |
The construction and operational aspects of the Huachuacaja dam are as follows:
· | Tailings dam built in stages; starting dam elevation is 4207 MASL(year 0 of operation) and final dam elevation is 4247 MASL(year 20 of operation). |
· | The dam will be built continuously from year 1 to year 20 of operation. |
The main characteristics of the tailings dam include:
· | Height: 56 m, for the final stage. |
· | Crest length: 808 m, for the final stage. |
· | Crest width: 20 m, for all stages |
· | Upstream Slope: 2.5H:1V, with a 5 m bench between each construction stage. |
· | Downstream Slope: 3H:1V, with a 55 m bench at elevation 4210 MASL. |
· | Volume |
Huachuacaja Dam Stability
The stability of the Huachuacaja tailings management facility dam has been evaluated by the limit equilibrium method, considering static, pseudo-static, post-seismic loading conditions. Additionally, stability has been evaluated by the stress-strain method, considering the seismic demand associated with the design earthquake, corresponding to the maximum credible earthquake (MCE).
SRK Consulting (Peru) S. A. | April, 2022 |
SRK Consulting Peru SA SEC Technical Report Summary – El Brocal | Page 234 |
The minimum safety factors considered as acceptability criteria correspond to 1.5 for static conditions, 1.0 for pseudo-static conditions, and 1.2 for post-seismic conditions. Table 15-3 shows the summary of safety factors for different stages of heightening.
Based on the results of stress-strain analysis, in the crest zone of the Huachuacaja dam, displacements in the order of 2.5 m vertically and 4 m horizontally are observed, without implying the loss of containment of the stored tailings.
SRK Consulting (Peru) S. A. | April, 2022 |
SRK Consulting Peru SA SEC Technical Report Summary – El Brocal | Page 235 |
Table 15-3: Results of Physical Stability Analyses of the Huachuacaja Tailings Dam.
Scenario | Section | Downstream Slope Safety | Upstream Slope Safety Factors | |||
Block-type Failure | Circular-type Failure | |||||
Static | Pseudo-static | Post-seismic | Static | Pseudo-static | ||
Stage 4 Elevations 4223 MASL | G-G´ | 2.64 | 1.01 | 1.32 | 4.54 | 1.29 |
| H-H´ | 3.43 | 1.02 | 1.49 | 4.54 | 1.29 |
| I-I´ | 3.42 | 1.01 | 1.50 | 4.54 | 1.29 |
| J-J´ | 3.31 | 1.01 | 1.38 | 4.54 | 1.29 |
Stage 5 Elevation 4228 MASL | G-G´ | 3.61 | 1.14 | 1.40 | 5.28 | 1.16 |
| H-H´ | 3.98 | 1.08 | 1.52 | 5.28 | 1.16 |
| I-I´ | 3.95 | 1.05 | 1.51 | 5.28 | 1.16 |
| J-J´ | 3.90 | 1.05 | 1.34 | 5.28 | 1.16 |
Stage 6 Elevation 4234 MASL | G-G´ | 3.64 | 1.16 | 1.40 | 4.53 | 1.27 |
| H-H´ | 3.54 | 1.08 | 1.45 | 4.53 | 1.27 |
| I-I´ | 3.34 | 1.06 | 1.41 | 4.53 | 1.27 |
| J-J´ | 3.42 | 1.08 | 1.22 | 4.53 | 1.27 |
Stage 7 4243 MASL | G-G´ | 3.49 | 1.19 | 1.42 | 4.53 | 1.09 |
| H-H´ | 3.31 | 1.11 | 1.38 | 4.53 | 1.09 |
| I-I´ | 3.43 | 1.15 | 1.49 | 4.53 | 1.09 |
| J-J´ | 3.28 | 1.13 | 1.23 | 4.53 | 1.09 |
Stage 8 4247 MASL | G-G´ | 3.38 | 1.20 | 1.37 | 5.87 | 1.14 |
| H-H´ | 3.24 | 1.14 | 1.36 | 5.87 | 1.14 |
| I-I´ | 3.31 | 1.14 | 1.45 | 5.87 | 1.14 |
| J-J´ | 3.13 | 1.12 | 1.20 | 5.87 | 1.14 |
Source: Golder
SRK Consulting (Peru) S. A. | April, 2022 |
SRK Consulting Peru SA SEC Technical Report Summary – El Brocal | Page 236 |
Operational Conditions for Dam Construction
The construction and operational aspects of the Huachuacaja Dam are as follows:
· | Tailings dam built in stages; starting dam elevation is 4207 MASL (year 0 of operation) and final dam elevation is 4247 MASL (year 20 of operation). |
· | The dam will be built continuously from year 1 to year 20 of operation. |
The construction of Stage 1 of the dam includes the following activities:
· | Diversion work for the construction of dam fills, consisting of a dam and diversion pipeline. |
· | Excavation of the first four (4) superficial meters of the foundation ground and subsequent replacement of this excavated area with resistant and inert rockfill material, until reaching the level of natural ground (Material 3 and 3A). |
· | The first layer of fill in the dam foundation will consist of boulder material - blocks (D50 = 0.8 m), Material 3A, which will have to reach up to 1 meter above the excavation level. A displacement by weight is foreseen in the area of soft soils (wetland) in the order of 1 m, and in some sectors, it will be greater than 1 m. Then the filling continues with Material 3 with a minimum thickness of 2 m (rockfill material), Material 2 with a minimum thickness of 1 m (transition material), and Material 4 (massive fill material for the dam). |
· | Filling with compacted moraine soil on the upstream slope. This is applicable on the entire upstream slope and with a minimum width of 10m. |
· | The rest of the dam body will be constructed with mine waste rock from the north pit. Fill compacted in layers of 1 m thick to form the dam body. The material used must be non-acid-generating. |
· | Waterproofing of the dam's upstream slope with 1.5 mm HDPE geomembrane. |
· | Installation of geotechnical instrumentation. |
· | Disposal of excess construction material in a dump located 2.0 km northwest of the tailings dam. |
Materials for dam construction come from the following sources:
· | Moraine material will be obtained from the moraine quarry, located 1 km north of the dam axis, on the eastern aspect of Huachuacaja valley. |
· | The boulder-block and rockfill material will be obtained from the intrusive quarry, located 2 km north of the dam axis on the western aspect of Huachuacaja valley. |
· | 100% of the mine waste material will be sourced directly from the north mine pit. The average haulage distance is 6 km. |
· | The drainage and filter materials will be obtained from the intrusive quarry and/or from San Juan River or Sacra Familia quarry, if not available in the first two (2) quarries mentioned above. |
The specifications for placement and compaction of materials are shown in Table 15-4.
SRK Consulting (Peru) S. A. | April, 2022 |
SRK Consulting Peru SA SEC Technical Report Summary – El Brocal | Page 237 |
Table 15-4: Specifications for Placement and Compaction of Dam Materials
Material | Description | Maximum Size (mm) | Maximum Layer Thickness (mm) | Compaction Equipment | No. of passes |
1 | Low Permeability fill – Moraine | 150 | 0.3 | Vibratory Roller 10 | - |
2 | Transition Material | 300 | 0.5 | Vibratory Roller 10 | 4 |
3 | Coarse-rockfill | 1000 | 1.0 | Vibratory Roller 10 | 4 |
3A | Boulders-Blocks | 2000 | 1.0 | - | - |
4 | Dam Body Mass Fill | 500 | 0.75 | Vibratory Roller 10 | 4 |
4A | Los Permeability Fill Waste Rock | 75 | 0.3 | Vibratory Roller 10 | - |
5 | Rolling Surfaces | 50 | 0.25 | Vibratory Roller 10 | |
10 | Geomembrane | - | - | Vibratory Roller 10 | |
Source: Golder
Periodic Inspection Policy
Protocols and reports are presented in the Project Operation Manual, which are:
· | Daily tailings management facility operation reports. Includes information on tonnage of tailings deposited, and areas discharged. |
· | Monthly reports of geotechnical monitoring of the tailings management facility. Includes monthly and cumulative statistics, water table, and tailings management facility displacement measurements. |
Continuous Monitoring Policy
CMB's policies and commitments are outlined in the Project Operation Manual, which includes the following main commitments:
· | Tailing’s particle sizes and solids % monitoring. |
· | Monitoring of excess water quality of the tailings management facility pond to be discharged to the environment. |
· | Tailing’s deposition sequence specified in this manual. |
· | Monitor the grade of the tailings management facility slopes (See Table 15-5). |
· | Monitoring of geotechnical instrumentation (see Table 15-5). |
Likewise, normal operating procedures for the tailings management facility include the following activities:
· | Control that the tailings water level does not exceed 5 m of freeboard. |
· | Permanently operate the slurry tailings pumping system. |
SRK Consulting (Peru) S. A. | April, 2022 |
SRK Consulting Peru SA SEC Technical Report Summary – El Brocal | Page 238 |
· | Permanently operate the tailings thickening system. |
· | Permanently operate the thickened tailings pumping system. |
· | Permanently operate the recirculated water pumping system. |
· | Permanently operate the excess water pumping system. |
· | Permanently operate the neutralization-sedimentation plant. |
· | Control the tailings management facility piezometers (weekly controls). |
· | Control the geotechnical instrumentation of the dam. |
· | Maintain the runoff diversion operational. |
SRK Consulting (Peru) S. A. | April, 2022 |
SRK Consulting Peru SA SEC Technical Report Summary – El Brocal | Page 239 |
Table 15-5: Geotechnical Instrumentation Monitoring Frequency.
Type of | Symbol | Location | Frequency of Measurement (in rainy season) | Frequency of measurement (in dry season) | Frequency of Measurement (Post-closure) | ||||||
First year | After the first | After the | First year | After the first | After the | In rainy season | In dry season | After | |||
Fiber optic piezometer | P-1 | Tailings dam foundation | Weekly | Monthly | Every other day | Monthly | Every 2 months | -- | Once (at the end of the season) | 1 time (at the end of the dry period) | Every other day |
Settlement cells | CA-1 | Tailings dam foundation (over rockfill) | Weekly | Monthly | Every other day | Monthly | Every 2 months | Every other day | Once (at the end of the season) | 1 time (at the end of the dry period) | Every other day |
Monitorig wells | PM-1 | Downstream and upstream of seepage collection pond | Monthly | Monthly | Every other day | Monthly | Every 2 months | -- | Once (at the end of the season) | 1 time (at the end of the dry period) | Every other day |
Alignment milestone | A-1 | Tailings dam crest | Weekly | Monthly | Weekly | Monthly | Every 2 months | Weekly | Once (at the end of the season) | 1 time (at the end of the dry period) | Weekly |
Topographic control point | HT-1 | Tailings Dam | Weekly | Monthly | Weekly | Monthly | Every 2 months | Weekly | Once (at the end of the season) | 1 time (at the end of the dry period) | Weekly |
Accelerograph | AC-A | In rock near | Every 6 months | After the event | Every 6 months | After the event | Every 6 month | After the event | |||
Routine inspections (visual): dam and dump site |
|
| Daily | Weekly | Daily | Daily | Every 2 months | Daily | Once (at the end of the season) | 1 time (at the end of the dry | Daily |
Formal inspection of dam and dump area |
|
| Evaluation after the first rainy season | Annual or as required | Evaluation agter the event |
| Annual or as required | Evaluation After the event | Annual or as required |
| Evaluation after the even |
Source: Golder
Notes:
1. | The automatic monitoring system will record readings from piezometers and settlement cells every 6 hours. In case of a seismic event, the piezometers located in the zone of possible settlement will record at a rate of 100 data per second. 2. For the specific case of earthquakes, monitoring will be carried out 12 hours after the seismic event, in no case before |
.
SRK Consulting (Peru) S. A. | April, 2022 |
SRK Consulting Peru SA SEC Technical Report Summary – El Brocal | Page 240 |
Mine Operations Support Facilities |
Portal Access |
The underground mine will be accessed through the following portals:
| ● | Bocamina Marcapunta Sur |
| ● | Bocamina Principal Marcapunta Norte |
Underground Workshop |
These facilities are placed for minor repairs and immediate support of equipment.
15.3.3Mine Administration Building
There are three offices buildings: Mine offices, Geology offices, and Main offices.
15.3.4 |
| ● | Warehouse |
This facility has an area of 800 m².
| ● | Workshop Building |
It is located in the operations zone.
| ● | Truck Fuel Facility |
The mining unit has the following fuel stations:
| ● | Fuel station Huaraucaca |
| ● | Fuel station Marcapunta Norte |
| ● | Fuel station Tajo Norte |
| ● | Fuel station Tajo Sur |
| ● | Explosives Storage |
There are two buildings: primary explosive storage and underground explosive storage. The central explosive storage is located near the west limit of the pit. This magazine has a storage capacity of 150 tonnes of ammonium nitrate, 90 tonnes of dynamite, and 130 tonnes of emulsion. The underground magazine is located in the projection of the RB N#04.
Processing Plant Support Facilities |
Laboratory |
The laboratory building is located in Huaraucaca’s industrial zone. The facility has the following working areas: sample preparation, assaying, testing facilities, warehouse, offices, toilets for Men & Women, and a dressing room.
First-Aid Facility |
The first aid facility is located in the industrial zone for early care treatment.
| May, 2022 |
SRK Consulting Peru SA SEC Technical Report Summary – El Brocal | Page 241 |
Man Camp |
There are three man camps: one is located in the Huaraucaca zone, and the other two are located in the Colquijirca zone.
Power Supply and Distribution |
The power supply for the project is obtained from two hydroelectric power stations owned by Sociedad Minera El Brocal (SMEB) and Electroandes. The mining unit energy is provided from the following facilities:
| ● | Hydroelectric Power Station Rio Blanco |
| ● | Hydroelectric Power Station Jupayragua |
| ● | Sub-station Tajo Sur |
| ● | Sub-station Plant N#01 |
| ● | Sub-station Plant N#02 |
| ● | Sub-station Marcapunta |
| ● | Sub-station Principal Cinco Manantiales |
| ● | Transmission line 138 KV-SS Cinco Manantiales, SS Cinco Manantiales, SS Oxidos – SS Paragsha |
| ● | Auxiliar lines |
Water Supply |
Water Source |
The source of freshwater for operations (metallurgical) comes from the Pun Run lagoon and the Blanco River. Previously, these waters supplied the hydroelectric plants of Rio Blanco and Jupayragra. Turbinated waters from the Jupayragra plant are captured and conducted to the Pilanco station, where three pumps are located; two are operation and one is on standby. From this point, the water is pumped to the freshwater reservoir with a capacity of 2,300 m³. This facility is located in the industrial zone of Huaraucaca, where the water is distributed for metallurgical operations and for use in related activities in the industrial zone of Huaraucaca. It is specified that in addition to the freshwater coming from the turbinated waters of the Jupayragra hydroelectric plant, the supernatant water from the tailings deposit is recirculated to the metallurgical process.
The industrial water recirculation system from the tailings deposit Huachuacaja consists of three pumps that drive the water through three lines of 16", 14" and 12" HDPE piping to the reservoirs of Plant No. 2, Plant No. 1 (1,600 m³ capacity each), and washing plant respectively, from where the water is distributed to the metallurgical processes.
Domestic Water Treatment Plant |
There are two domestic water treatment plants:
| ● | Colquijirca plant N#01 has an area of 120 m² and a treatment capacity of 3.8 m³/h |
| ● | Colquijirca plant N#02 has an area of 60 m² and a treatment capacity of 2 m³/h |
| ● | Huaraucaca plant has a treatment capacity of 2.78 L/s. |
| May, 2022 |
SRK Consulting Peru SA SEC Technical Report Summary – El Brocal | Page 242 |
15.9Waste Water Treatment and Solid Water Disposal
Waste Water Treatment |
Acid Water Treatment
This facility has an area of 10 ha. It can treat 240L/s of acid water through the High-Density Sludge process.
Domestic Water Treatment
Domestic wastewater treatment plants (PTARD) Huaraucaca; There are two plants in the industrial zone of Huaraucaca. They are compact plants with an installed treatment capacity of 58 m³/d each. The effluents are treated through a biological process of activated sludge.
Domestic wastewater treatment plant (PTARD) Camps Colquijirca: The approximate flow sent to the plant is 69 m³/day. In addition, there is the option of reusing the water treated for irrigation of roads in the control of dust and irrigation of green areas inside of the unit.
Solid Waste Disposal |
The solid waste disposal facility has an area of 6.5 ha.
| May, 2022 |
SRK Consulting Peru SA SEC Technical Report Summary – El Brocal | Page 243 |
Market Studies |
El Brocal markets |
Copper market |
Overview of the copper market
The copper industry is the world’s largest base metal industry. Some of the key properties of this metal are that it is malleable, ductile and a good conductor of heat and electricity when in a pure form. Copper is water resistant and obtains a green patina when oxidized (as seen in construction when roofs turn green). Furthermore, it is germicidal, and can kill a variety of potentially harmful pathogens; this means that it can be used to make water safe for drinking or as an anti-germicidal surface to be used in buildings such as hospitals.
Refined copper is transformed into various semi-fabricated products – wire rod, rods, bars and sections, strip, sheet, plate, and tubes – and later used in a number of final end uses in construction, the automotive industry, manufacturing, architecture, and other applications.
| ● | Copper wire rod is used to make copper wire and cable, primarily for power distribution, but also for telecommunications. Building wire is the most common use of wire rod and is the single biggest end use of copper. |
| ● | Copper tube & alloy tube have a wide variety of end-uses. However, its two most significant end-uses are plumbing tube and use in the manufacture of HVACR (Heating, Ventilation, Air Conditioning & Refrigeration) products. |
| ● | Copper flat rolled products are widely used in applications such as electrical products, building & construction, automotive and military segments. Copper and copper alloy sheets and strips are used in the building industry to manufacture doors and hinges, switches, wiring, locks, and electrical outlets. |

Figure 16-1: Copper demand by end-use product and sector
Source: CRU
On the supply side, refined copper is made by mining, processing, and refining a variety of copper oxide and sulphide ores. Approximately ~70% of mined ore comes from open pit operations, with the remaining ~30% coming from underground mines.
| May, 2022 |
SRK Consulting Peru SA SEC Technical Report Summary – El Brocal | Page 244 |
Sulphide ores are processed via smelting. Ore is crushed, ground, and concentrated by froth flotation to produce a concentrate that can vary between 20%-40% copper contained. Concentrates is fed into a smelter, where copper oxidizes at high temperatures to produce blister copper (purity of 97-99% Cu). Blister copper is cast into large slabs that are used as anodes in the electrolytic refining process which produces 99.99% pure (LME grade) copper.
Oxide ores are processed via the hydrometallurgical process. This process involves the leaching of the ore using sulphuric acid. The Solvent Extraction and Electrowinning processes (SX-EW) allows copper to be recovered from the solution resulting from the leaching process.
Scrap can be used at different stages of the copper production chain depending on its quality. Low grade scrap can be used as feedstock into integrated smelter-refinery operations that wish to increase blister production, whilst high grade scrap can be sold directly to refining only operations to be cast into copper anodes.

Figure 16-2: Copper value chain
Source: CRU
Copper value chain
The following figure shows a simplified version of the copper value chain:
| May, 2022 |
SRK Consulting Peru SA SEC Technical Report Summary – El Brocal | Page 245 |
Figure 16-3: Simplified Copper value chain
Source: CRU
The primary trading form for copper is copper cathodes. This refined copper can further be transformed is also traded into various semi-fabricated products – wire rod, rods, bars and sections, strip, sheet, plate and tubes. These forms are usually traded at a premium to the benchmark copper price.
In addition, intermediate products, such as copper concentrates, copper blister and copper anodes are also traded. Around 80% of copper cathode production comes from copper concentrates, with only the remaining 20% coming directly from cathodes produced through the hydrometallurgical route (leaching & SX/EW).
Selling cathode is a much different, and simpler, marketing activity compared to selling copper concentrate. Cathode is a standardised product, whereas concentrate can vary widely in quality and value. Pricing for the two products is also different, with concentrate more prevalently subject to penalties due to impurities and credits due to payable metals such as gold and silver. Similarly, the logistics requirements and customers for each product also vary. Cathodes are often sold to manufacturing customers, meaning semis producers of wire rod, wire and cable, and can also be sold to traders. Concentrate, on the other hand, is sold to copper smelters or to traders.
Copper concentrates
The value of copper concentrates is determined by a number of factors other than the value of the content of each main metal in the concentrate.
As part of the agreements between concentrate sellers and buyers, a percentage of metal payable by the smelter is defined, as well as Treatment Costs (TCs) and Refining Costs (RCs) for key elements present in the concentrate.
In most copper concentrate contracts, copper, gold and silver are specified as the only payable metals:
| ● | For copper, typically 96.5-96.75% of the copper content is paid for, subject to a minimum deduction of 1 unit. However, this might vary from contract to contract and many contracts specify a sliding scale, so that the higher the copper content, the higher the percentage paid for. |
| ● | For gold and silver, a sliding scale is applied, with payables normally going from 90% to 98.25% for gold and 90% to 95% for silver subject to a minimum deduction of 1 g/t concentrate in case of gold, and 30-50 g/t concentrate in case of silver. |
| May, 2022 |
SRK Consulting Peru SA SEC Technical Report Summary – El Brocal | Page 246 |
Treatment and refining charges for copper concentrates include a TC expressed in US$/dmt of concentrates and a RC expressed in US$ cents/lb of copper. For gold and silver content, a RC is considered, expressed in US$/troy ounce.
When it comes to penalties, there are a number of elements that routinely qualify for penalties if they are present above a fairly low level in copper concentrates. These elements include arsenic, bismuth, antimony, mercury, lead, fluorine and chlorine. Other elements may also incur penalties, though only at higher concentrations. They include zinc, nickel, cobalt, silica, alumina and tellurium. If present in significant quantities, they may affect the recovery of copper or cause problems during smelting and refining. Finally, penalties may be payable or the material may only be suitable for blending if certain element fall below fixed thresholds. Most particularly this is true for sulphur and iron, where there is a minimum ration of copper to sulphur and iron that makes the material suitable for smelting.
Copper market balance and price
The following price forecast represents CRU’s forecast as of April 2021.
Global refined copper demand is expected to grow from 23.9 Mt in 2021, to 26.5 Mt in 2026 at a 2.14% CAGR. This 2.6 Mt increase in consumption will be partially driven by the post Covid-19 pandemic economic recovery, but also by the increasing penetration of electric vehicles and renewable energies. On the other hand, refined copper supply is expected to reach a bit under 26.5 Mt in 2026, close to 2.6 Mt up from the 23.9 Mt produced in 2021, growing at a 2.07% CAGR during this period. At the same time, committed mine supply will peak in 2024 at 22.7 Mt, up from 21.3 Mt in 2021, and then go back down to 21.4 Mt in 2026 due to the lack of committed projects in the pipeline. Ultimately, copper nominal prices are expected to temporarily decrease from 9,315 US$/t in 2021, to 8,222 US$/t in 2024 as refined copper supply outpaces demand within this period. After 2024, CRU expects prices to climb back up to 9,308 US$/t in 2026, supported by the increasing copper demand coming from EVs and renewable energies, coupled with the previously mentioned lack of committed mine projects.
Figure 16-4: Copper supply-demand gap analysis, 2021 - 2036, kt
Source: CRU
Coming from a strong 4.7% year-to-year rebound from 2020 to 2021, refined copper demand growth is
| May, 2022 |
SRK Consulting Peru SA SEC Technical Report Summary – El Brocal | Page 247 |
expected slowdown during the forecast period, hitting y-to-y growths of >2% from 2021 to 2024 and 1.7% from 2025 to 2026, as the effects of the pandemic wear-off. At the same time, CRU expects copper demand to grow by 2.6 Mt in the next five years, reaching 26.5 Mt consumed in 2026, with a particularly strong growth of 3.6% CAGR coming from Asia ex. China between 2021 and 2026. During this period, demand is expected to be driven mainly by the industrial and automotive sector’s recovery, coupled with a rapid penetration of EVs and renewable energies in the coming years. On the supply side, refined production will continue to grow strongly, increasing by 2.9% y/y in 2022 and 2023, aided by several smelter projects that are due to start-production in China. Meanwhile, ex. China smelter projects will play a more prominent role from 2024 onwards, namely those in Indonesia and India, with refined supply reaching 26.5 Mt in 2026, from 23.9 Mt in 2021. At the same time, committed mine supply is expected to go back to its pre-pandemic y/y growth and peak in 2024 with a production of ~22.7 Mt, and then drop to 21.4 Mt in 2026, leaving a gap of ~1.8 Mt to be filled by projects currently classified as probable and possible.
As mine supply and smelter capacity recovers, the market balance is expected to go further into surplus up until 2024. Going forward, this surplus is expected to turn into deficit in 2026, as production is unable to keep up with demand.

Figure 16-5: Copper Market Balance 2021 – 2026 (kt)
Source: CRU
The ramping up of new projects during the 2021 – 2024 period and the consequent market surplus are expected to take nominal prices from 9,315 US$/t in 2021 down to 8,222 US$/t in 2024. After this, the prevailing narrative constructed around the green energy transition and a prospective lack of new mine supply, which is forecasted move the market into deficit after 2025, is expected to start influencing mediumterm prices. As a result, copper price is forecast to swing back up to 8,758 US$/t in 2025, to eventually hit 2021-levels in 2026, reaching 9,308 US$/t in nominal terms.
| May, 2022 |
SRK Consulting Peru SA SEC Technical Report Summary – El Brocal | Page 248 |
Figure 16-6: LME Copper cash prices, 2021-2036 (US$/t)
Source: CRU
Table 16-1: Copper LME cash prices 2021 – 2036 (US$/t)

Source: CRU
Zinc market |
Overview of the zinc market
Zinc – the fourth most widely consumed metal in the world following iron, aluminium and copper – is an excellent anti-corrosion agent and bonds well with other metals. It is also moderately reactive and a fair conductor of electricity. It is well-recognised for its effectiveness in protecting steel against corrosion by galvanising, and as such this accounts for 60% of total zinc consumption. Galvanised zinc is widely used in multiple industrial applications such as automobile bodies, air conditioners and more. Zinc is also commonly used for alloy production, as well as chemical uses and battery production.
By end-use sector, construction and transportation add up to ~70% of total demand. In the transportation sector, the automotive industry accounts for around 10% of global zinc demand.
| May, 2022 |
SRK Consulting Peru SA SEC Technical Report Summary – El Brocal | Page 249 |

Figure 16-7: Global zinc demand by first-use sector and end-use sector
Source: CRU
In terms of mine production, around 80% of zinc mines are underground, only 8% are open pit mines and the remaining 12% are a combination of both. Zinc ores contain only around 5-15% zinc and need to be concentrated before being processed by smelters. A typical zinc concentrate contains 50-62% Zn and other elements such as Pb, S, Fe, SiO2 and silver. Metallic zinc can be recovered from the concentrate by using either hydrometallurgical or pyrometallurgical techniques. Today, over 90% of zinc is produced hydrometallurgically in electrolytic plants.
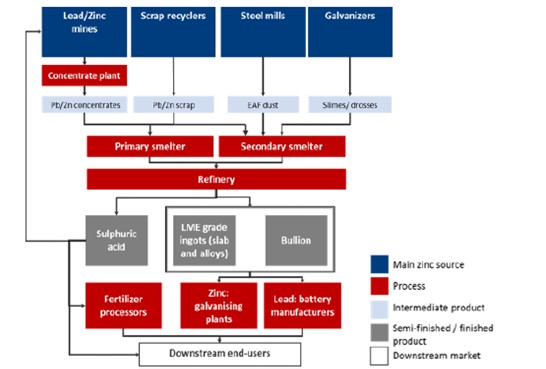
Source: CRU
Zinc value chain
The following figure shows a simplified version of the zinc value chain:
| May, 2022 |
SRK Consulting Peru SA SEC Technical Report Summary – El Brocal | Page 250 |

Figure 16-9: Simplified zinc value chain
Source: CRU
Mine production accounts for the vast majority of refined zinc supply. In 2020, ~89% of the refined zinc was produced from concentrates.
Zinc concentrates are an intermediate product in the production of refined zinc, and typically contain 50-62% zinc. In addition, concentrates may contain economic levels of gold and silver which can be recovered during the smelting process and are therefore typically paid for by the smelter. Recovery rates depend on the smelter setup but, given that lead smelters are able to reach high recovery rates for silver, it is often the case that the silver-lead residue is captured and then processed at a sister lead smelter. This means that payables are not necessarily linked to recoveries in the zinc smelter itself, but that residue processing and transportation costs are taken into account when negotiating them.
Metallic zinc can be recovered from the concentrate by using either hydrometallurgical or pyrometallurgical techniques. Today over 90% of zinc is produced hydrometallurgically in electrolytic plants. The pyrometallurgical process is a less common type of metallurgical process.
The majority of zinc producers are not fully integrated from mine to finished product. As a result, zinc concentrates are widely traded by mines to smelters, often through a merchant.
Zinc concentrate
The miner usually gets paid certain percentage of zinc, gold and silver contents in the concentrates sold:
| ● | The industry-standard zinc payable formula states that the buyer will pay for a certain proportion of the contained zinc, typically 85%, subject to a minimum deduction levied on the overall grade of the zinc concentrate. This minimum deduction typically stands at eight units (or eight percentage points). A well-run modern smelter will now recover between 90-99% of the zinc content of its feed. The remaining “free zinc” the smelter gets becomes part of the smelter's expected revenue from a purchase of concentrates. |
| ● | In most occurrences, zinc concentrates have a naturally low gold content. However, given the high value of gold units, these are attractive to recovered even at low levels, with recovery rates varying depending on the smelter. Typically, payable terms range between 70-80% of the gold content with a minimum deduction of 1g Au per tonne of concentrate with no RC. |
| ● | Silver is a relatively common occurrence in zinc deposits, and if present in sufficient quantities, will be payable in a zinc concentrate contract. However, fewer zinc smelters can recover silver as easily or effectively as smelters of other metals, hence less silver is paid for in a typical zinc concentrate contract than other concentrates. Silver in zinc |
| May, 2022 |
SRK Consulting Peru SA SEC Technical Report Summary – El Brocal | Page 251 |
concentrate is usually subject to a 3 troy ounce deduction (93.3 g/t) and then a 70% payability.
In addition to the main payable metals above, indium can be paid by some smelters if it is present in high quantities. However, this happens in rare occasions, and it is usually recovered by the smelters but not paid to the miner.
Zinc concentrates all contain a host of other elements, and some of these can create operational difficulties for smelters and refineries. Actual penalties will vary according to the ability of the specific smelter to handle each impurity. Typical elements which receive penalties when above certain thresholds include arsenic, bismuth, antimony, mercury, fluorine and magnesium.
Zinc concentrates are also subject to a treatment charge (TC). The spot TC market is almost entirely constituted of China, whereas negotiations in the European market are mainly negotiated on an annual contract basis. Hence, benchmark price for China is spot TC, while for Europe is annual TC.
In Western markets, it is also common to find price participation clauses. These represent a form of profit-sharing between the smelter and the miner, such that depending on the LME zinc price, then the TC on the zinc concentrate is adjusted by an escalator to transfer some of the price risk to the smelter. Chinese smelters usually do not apply price participation clauses, meaning that there is a fixed TC charge for Chinese smelters to process concentrates, and this is not affected by the prevailing zinc price.
Zinc market balance and price
The following price forecast represents CRU’s forecast as of April 2021.
The global refined zinc market was in deficit with demand exceeding supply in most of the years between 2015 and 2019. The only exception was 2015 when the market was in high surplus due to a demand depression driven by a slowdown of industrial production, automotive and construction sectors, together with a moderate growth (~3.6% y/y) of refined zinc production. This relatively tight market supported an environment of rising prices between 2015 and 2018, with prices going from US$1,928 to US$2,922 per tonne. With a reduced refined zinc market deficit, an accumulation of concentrate market surplus and the exit of bullish investors, LME zinc cash prices fell dramatically to US$2,546/t in 2019.CRU estimates that the market has moved from a moderate deficit of -235 kt Zn in 2019 to a considerable surplus of 536 kt Zn in 2020, driving prices down to US$2,267/t.
Going forward, global smelter output growth is expected to slow but refined zinc surpluses will continue to build, as demand growth is expected to remain lackluster. The cumulative refined surplus is expected to continue to increase to 2025, the majority of which will be in the world ex. China. Although prices are expected to increase in 2021, the overall surplus in the following five years will result in lower prices, with the average annual price expected to reach US$1,955/ t in 2025 in nominal terms.
In the long term, CRU expects smelting capacity will be able to support the demand for primary zinc, as new smelting capacity can come on stream relatively easily if the market requires it. Mined zinc supply will therefore be the bottleneck to global zinc market growth, and prices will need to
| May, 2022 |
SRK Consulting Peru SA SEC Technical Report Summary – El Brocal | Page 252 |
adjust in order to incentivize investment into new mining capacity. Based on the supply-demand gap expected at a mine level, new mining projects will be needed from 2026 forward.

Figure 16-10: Zinc supply-demand gap analysis, 2021 - 2036, k
Source: CRU
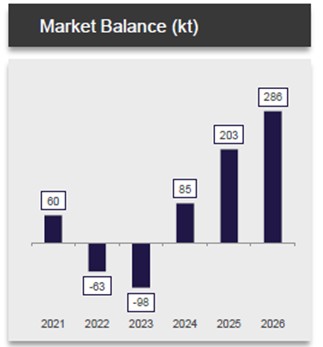
Figure 16-11: Zinc Market Balance 2021 – 2026 (kt)
Source: CRU
Smelter disruption affected the supply sector in a transversal way in 2021. Refined supply was supplemented by the release of zinc stocks, but an outperforming demand growth mainly in Europe and the USA, and a weak response from the supply-side, led to a tightly refined surplus of 60 kt in 2021, pressing prices up to $3,033 /t. CRU expects the global refined market to switch to deficit in 2022 and 2023, generating supportive fundamentals for the metal price increase, but returning to surplus from 2024 onwards. Thereafter, CRU expects prices to fall deep against a backdrop of cumulative surpluses to bring the market back to a sensible balance, hitting its lowest point in 2025, equivalent to $2,134 /t. Nevertheless, prices will need to correct to rebalance the market, pushing prices up again in 2026, leaping up to $2,348 /t.
| May, 2022 |
SRK Consulting Peru SA SEC Technical Report Summary – El Brocal | Page 253 |

Figure 16-12: LME zinc cash prices, 2021-2036 (US$/t)
Source: CRU
Table 16-2: Zinc LME cash prices 2021 – 2036 (US$/t)

Source: CRU
Lead & silver markets |
Overview of the lead market
Historically, lead was used in a wide variety of applications, but these have narrowed in time due to technological advances as well as environmental & health pressures. Currently, lead consumption has become dominated by its application in lead-acid batteries (LABs), which accounts for ~85% of total lead consumption.
The greater portion of lead consumed in the battery sector is dedicated to SLI Batteries (Starting, Lighting and Ignition), which are mostly found in cars and motorcycles. Going forward, both production of new vehicles (or OE, Original Equipment) and replacement of failed batteries in existing vehicles are important demand drivers. These are followed by industrial batteries, accounting for nearly a third of lead demand. The rest is for non-battery uses including submarine cables, some chemicals and radiation shielding. Lead’s incorporation into paint, petrol, solders, galvanising alloys and other less relevant uses is fast disappearing.
| May, 2022 |
SRK Consulting Peru SA SEC Technical Report Summary – El Brocal | Page 254 |
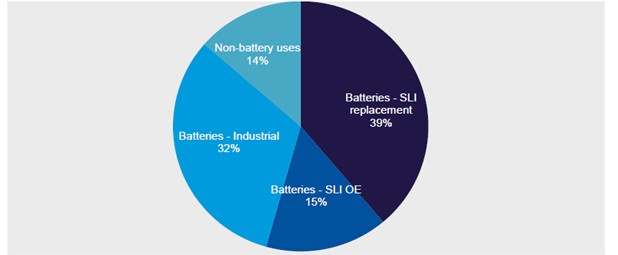
Figure 16-13: Lead demand by end-use sector
Source: CRU
On the supply side, due to the polymetallic nature of most lead mines, lead production is significantly impacted by the production of other metals. The main minerals where lead is found often contain silver, zinc, and copper, and commercial ores can have a lead content from 2% to >20%.
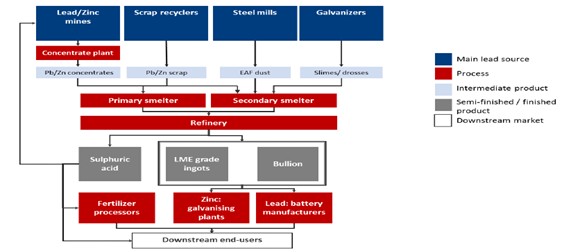
Figure 16-14: Lead industrial value chain
Source: CRU
Lead value chain
Lead is normally found as an accessory mineral within the ores of other base metals such as zinc, silver, copper and sometimes gold. Due to the polymetallic nature of the vast majority of lead mines, production is significantly impacted by the production of other metals, in particular by that of zinc and silver. Indeed, in many of these mines, lead is the by-product, or at least not the main focus of mining.
The following figure shows the value chain for lead production:
| May, 2022 |
SRK Consulting Peru SA SEC Technical Report Summary – El Brocal | Page 255 |

Figure 16-15: Simplified lead value chain
Source: CRU
Most of lead supply is obtained from recycled material, accounting for 63-65% of total production.
The remaining ~35% of lead supply comes from mine production, specifically from concentrates containing lead. The concentrate is an intermediate product generated when the more diluted lead content of the mined ore is beneficiated at a concentrate plant. Lead concentrates can have a lead content of up to 50% Pb and are sold by mines directly to lead smelters or to traders.
Lead concentrate
Unlike other types of concentrate, estimating the specifications of a ‘typical’ lead concentrate is difficult due to the wide range of lead concentrate qualities produced at individual mines and the differing preferences of smelters to treat the array of material being offered by the market.
On the mine supply side, there is a clear split between higher volumes of more complex ‘high-silver’ lead concentrates and a much scarcer flow of ‘low-silver’ lead concentrates.
On the concentrate demand side, most smelters have some ability to recover silver, though it typically comes down to the payment terms in order to make it sufficiently attractive to process such material. This is particularly important for Chinese smelters, where Chinese silver prices are lower than international prices. Though this discourages them from treating ‘high-silver’ feed, Chinese smelters will still continue to buy ‘high-silver’ concentrates because ‘low-silver’ concentrates are in short supply. They will also strive for terms that reflect the associated tighter margins of treating such material. As a result, lead concentrates attract different treatment charges (TCs) depending on whether they are catalogued as low-silver or high-silver concentrates. For TC purposes, a ‘high-silver’ lead concentrate has ~3,100g/t of silver and ~70% lead content, while a ‘low-silver’ concentrate has less than 400g/t of silver and ~65% lead content.
It is also common to find price participation clauses in lead concentrate sales. These represent a form of profit-sharing between the smelter and the miner, such that depending on the LME lead price, then the TC on the lead concentrate is adjusted by an escalator to transfer some of the price risk to the smelter. It is usually the case that contracts for ‘low-silver’ lead concentrates include price participation, whereas ‘high-silver’ terms usually do not include price participation. Terms for concentrates with a silver content between 400 and 3,100g/t vary as they can follow either structure and, as the case with all concentrates regarding of their silver content, the structure of the final contract is ultimately the result of negotiations between parties and there are no rules set in stone.
| May, 2022 |
SRK Consulting Peru SA SEC Technical Report Summary – El Brocal | Page 256 |
When it comes to metal payables, payable terms do not discriminate based on silver content. Regardless of the silver content, the payable stays the same for main payable materials of lead, gold and silver:
| ● | Modern smelters are quite efficient. A typical smelter recovers around 97% of the lead. Hence, the lead payable terms are high at 95% of the concentrate content subject to a minimum deduction of 3%. |
| ● | Silver is usually the second most valuable material in the lead concentrate. The terms are 95% payable, subject to minimum deduction of 30g/t with RCs applied on payable silver content. RCs can vary depending on silver content and market conditions and have fluctuated between US$0.6-1.5/oz in later years. |
| ● | Gold is less often found with lead-zinc deposits. Having said that, typical terms consider a 95% payable, subject to minimum deduction of 1g/t with RCs applied on payable gold content. RCs are relatively standard at US$5.0/oz. |
In addition to the main payable metals above, lead concentrates all contain a host of other elements, and some of these can create operational difficulties for smelters and refineries. Actual penalties will vary according to the ability of the specific smelter to handle each impurity. Some typical elements which could attract penalties when above certain thresholds include arsenic (penalised when levels are above 0.1%), mercury (penalised when levels are above 15ppm), bismuth (penalised when levels are above 0.02%) and antimony (penalised when levels are above 0.3%).
Lead market balance and price
The following price forecast represents CRU’s forecast as of May 2021.
The global refined lead market moved steadily from a small surplus of only ~20 kt in 2015 to a deficit of 113 kt in 2018 and a slightly lower deficit of 72kt in 2019. From a price perspective, there was a downward correction in 2015 to reflect a relatively high stock level, before lifting to US$2,317/t in 2017 owing to tight concentrate and refined lead markets. Lead prices continued to stay high at US$2,242/t in 2018 but fell to US$2,000/t in 2019, primarily due to the breakdown of US-Chinese trade talks and the return of further import tariff hikes.
CRU estimates the refined lead market saw a global surplus of 91 kt in 2020 as demand decreased more than production in the midst of the Covid-19 pandemic. As a result, prices dropped significantly to US$1,826 /t.
In 2021, CRU expects another year of surplus – both demand and supply are expected to pick up from 2020 levels, but consumption is still expected to lag slightly behind supply. The shrinking surplus in 2021 heralds a change towards 2025, one of a re-tightening path. The key dynamic at play will be a greater slowdown in primary than in secondary production growth. This will trigger overall production growth to slow by more than consumption growth, thus moving the global market back into deficit in 2023-2025. As a result of these changes, CRU expects an LME lead cash price recovery from US$1,980/t in 2022 to US$2,240/t in 2025.
In the long term, lead will continue to be weighed down in investors’ eyes by a lack of a compelling positive narrative in the 2020s, not least relative to other ‘battery’ metals like lithium, cobalt and nickel in the vehicle electrification story. We believe that lead’s tarnished image among the investment community is somewhat misplaced, given its current and future dominant role in most battery sectors and impressive ‘green’ recycling record. Yet the very success of lead recycling will perhaps act as a drag on lead prices, with this ‘closed loop’ resulting in smaller market imbalances ahead compared to other more primary supply-driven metals like copper.
| May, 2022 |
SRK Consulting Peru SA SEC Technical Report Summary – El Brocal | Page 257 |
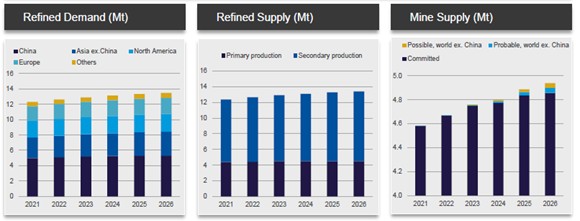
Figure 16-16: Lead supply-demand gap analysis, 2021 - 2036, kt
Source: CRU

Figure 16-17: Lead Market Balance 2021 – 2026 (kt)
Source: CRU
The market surplus generated coming out of the Covid-19 pandemic is expected to slow down the upwards price trend that has been taking place since early 2020 and, consequently, nominal price is expected to hit 2,271 US$/t in 2022 before dropping to 2,239 US$/t in 2023. After 2023, prices are forecast to rise as the World’s refined lead demand progressively outpaces production going to 2026. Subsequently, as this imbalance turns into deficit, prices are expected to hit 2,391 US$/t by the end of the forecasted period.
| May, 2022 |
SRK Consulting Peru SA SEC Technical Report Summary – El Brocal | Page 258 |

Figure 16-18: LME cash lead prices 2021 – 2036, US$/t
Source: CRU
Table 16-3: Lead LME cash prices 2021 – 2036, US$/t

Source: CRU
Overview of the silver market
Silver is often compared to gold given its ancient usage in jewellery and coinage, which now account for 30% and 8% of silver demand respectively. The main distinction between both markets is that silver has more extensive uses in industrial applications, with electrical/electronic uses accounting for 23% of demand. Like gold, silver is used in electronics for its excellent electrical conductivity, lack of corrosion, and ease of mechanical use – but given its lower price point and higher availability, it sees far more widespread usage than gold in this area.

Figure 16-19: Silver demand b end-use
Source: CRU
In terms of supply, mined silver makes up ~80% of this total silver production, with recycled silver scrap accounting for the rest. Furthermore, only 25% of mined silver comes from mine which
| May, 2022 |
SRK Consulting Peru SA SEC Technical Report Summary – El Brocal | Page 259 |
produce silver as their primary metal, while the remainder of mined supply is produced as a by-product from polymetallic mines that may also produce zinc, lead, or copper. Because of this, the silver market is highly diversified with the top eight producers only making up less than 30% of global mined supply.
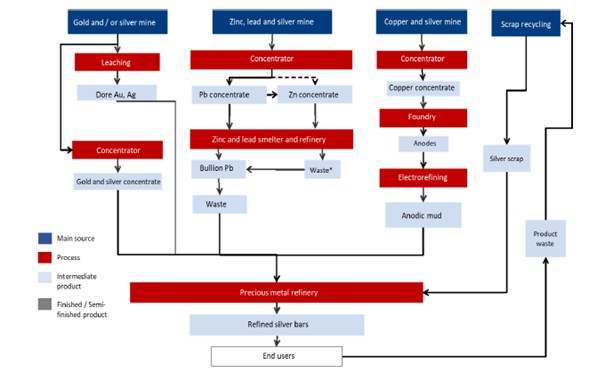
Figure 16-20: Silver value chain
Source: CRU
Silver market balance and price
The following price forecast represents CRU’s forecast as of March 2021.
The silver market is currently going through a phase of rapid market rebalancing as it shifts from a period of deficit from 2016 to 2019, to a surplus in 2020 and forward. With the Covid-19 pandemic, fabrication demand was hit harder than supply, which resulted in a small surplus for the year. Both supply and demand are expected to rebound in 2021, bringing the market back into a deficit. In the medium term, the market is expected to remain relatively well balanced, alternating between years of surplus and undersupply. Demand is expected to peak in 2024 as increases in the jewellery sector – the main end use for silver –are not enough to offset dwindling demand from other end uses, and the market is expected to see an increasing surplus into the long term.
On the price side, and similarly to gold, silver prices do not tend toward equilibrium like other commodities. Instead, price is often linked to sentiment rather than fundamental market forces. Since 2015, prices have been relatively stable, ranging between US$16 and US$17 per troy ounce between 2015 and 2019. The uncertainly brought by Covid-19 pushed prices up to US$20 /oz in 2020. This tendency is expected to continue out to 2025, when prices are expected to peak at US$34 /oz.
| May, 2022 |
SRK Consulting Peru SA SEC Technical Report Summary – El Brocal | Page 260 |

Figure 16-21: Silver supply-demand gap analysis, 2021 - 2036, kt
Source: CRU

Figure 16-22: Silver Market Balance 2021 – 2026 (kt)
Source: CRU
Rising uncertainty about the strength of the post-pandemic global economic recovery will keep reining in growth in industrial demand. This, combined with a robust recovery in metal supply, will reduce the fundamental deficit, leading to a more balanced silver market in 2022-2023. CRU does not expect to see a sustainable return in buying interest towards this precious metal until late 2022 with the nominal annual average silver price dropping from $25.1/oz in 2021 to $23.3/oz in 2022. Starting from 2023, market fundamentals will start to retighten as industrial demand for silver (ex-coins) fully recovers from the pandemic shock and mine supply weakens driven by grades degradation, reserves exhaustion and mine closures. This will spark a resumption of the silver bull rally and pushing nominal prices all the way up to $31.1/oz in 2026.
| May, 2022 |
SRK Consulting Peru SA SEC Technical Report Summary – El Brocal | Page 261 |

Figure 16-23: Silver price forecast, 2015 – 2036, US$/oz
Source: CRU
Table 16-4: Silver prices 2021 - 2036, US$/oz
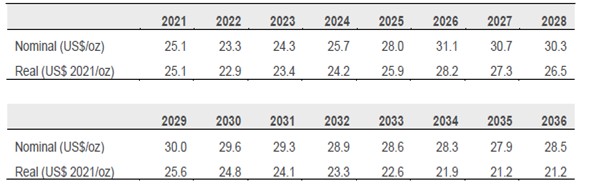
Source: CRU
El Brocal products |
Summary of El Brocal products |
The following tables summarizes the main specifications of each concentrate produced by El Brocal:
| May, 2022 |
SRK Consulting Peru SA SEC Technical Report Summary – El Brocal | Page 262 |
Table 16-5: Typical specifications of El Brocal’s concentrates
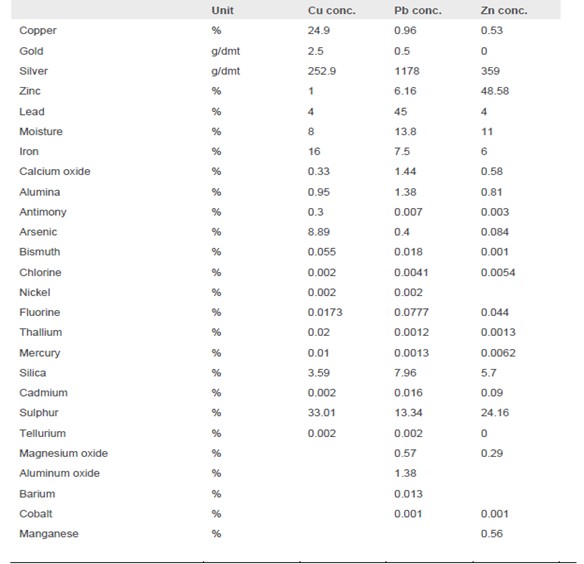
Source: Buenaventura
This section aims to assess and compare El Brocal’s products to other players in the industry. This is done by showing where each product stands when compared to estimated specification from a large sample of mines. The figures presented show the minimum and maximum content of each element under analysis in the samples of mines used, as well as the median and the distribution around it segmented in quartiles in the following way:

Figure 16-24: Figure Sample boxplot
Source: Buenaventura
| May, 2022 |
SRK Consulting Peru SA SEC Technical Report Summary – El Brocal | Page 263 |
Cu concentrate |
El Brocal is the only mine of Buenaventura that produces copper concentrate. To compare it against other industry players, a sample of 337 mines from CRU’s Copper Cost Model (out of which 110 are located in Latin America) was used to compare copper grade specifications, considering data from 2015 to 2019. At the same time, a sample of 238 mines was used to compare gold and silver content in copper concentrate, excluding those copper concentrates with no gold or silver content from the original sample.

Figure 16-25: Copper concentrate of El Brocal mine
Source: CRU
In 2019, Buenaventura produced ~43 kt Cu contained in concentrates. The company does not have smelting capacity to process the material, hence it needs to sell the product to the market.
Global smelting capacity in 2019 was 24 Mt of copper per year. Copper concentrates are mostly sold to Asia, where most of smelting capacity is located. Approximately ~40% of copper smelting capacity can be found in China, followed by Japan (~7% of global smelting capacity) and South Korea (~3% of global smelting capacity). Outside Asia, other relevant location is Europe, which has 16% of smelting capacity worldwide. The Americas account for 15% of smelting capacity, while Africa accounts for a relatively minor amount of global capacity at ~6%.
Some of the major Asian companies have bought stakes in copper mines to secure long-term feedstock material and fulfil domestic demand needs for the material. After excluding copper concentrate flows based on equity interests, the remaining smelter capacity available to purchase copper concentrates from the custom market is estimated at 5.5 Mt Cu.
Buenaventura’s copper concentrate has substantial payable metal content. It has high copper and silver, with reasonable gold content. However, the product has very high arsenic content. With arsenic levels of 6.5-9.5%, this would make selling the concentrate directly to smelters almost impossible, as they would have to extensively blend the product to reach a more generally acceptable level of 0.2% As content (although certain smelters are capable of processing higher levels).
| May, 2022 |
SRK Consulting Peru SA SEC Technical Report Summary – El Brocal | Page 264 |
Blending is a relatively simple physical process of mixing different products into a new homogeneous concentrate. This process is used particularly for low-grade and complex material. In places like Peru with considerable production of variable material, it is a common practice.
Buenaventura’s copper concentrate from El Brocal has three potential outlets:
1. | Being blended to lower arsenic content to acceptable levels, to later be sold to the customs market or to specific smelters. Since access to low-arsenic material is needed, this operation is carried out by traders with access to enough low-arsenic copper concentrates in Peru. Given the high levels of arsenic in El Brocal’s copper concentrate and the large amount of material needed to bring arsenic levels down to acceptable levels, only small volumes of El Brocal’s concentrate ends up being blended. |
2. | Given the high amount of arsenic present in the concentrate and the presence of both gold and silver, small amounts of this concentrate can be blended with precious metals concentrates. Since precious metals concentrates can be imported into China regardless of their arsenic content, this is an option to open up this market to this particular concentrate. |
3. | As blending becomes increasingly impractical, mines like El Brocal depend on specialist smelters that can handle this material. Outside of China, only one copper smelter in the world is capable of processing large volumes of ultra-high arsenic copper concentrates for the custom market: Tsumeb smelter in Namibia. |
Given that El Brocal’s copper concentrate has levels of arsenic which make the concentrate difficult for smelters to process and for traders to position in the market, this translates into a high penalty, which is reflected in Buenaventura’s past contracts. However, even with its difficulties, the concentrate is ultimately sold to players in the industry who have experience handling it. Looking forward, Buenaventura has contracts in place securing sales for 100%, 75% and 15% of the copper concentrate production coming from El Brocal in 2022, 2023 and 2024, respectively. Buenaventura has long-standing relationships with these buyers, and it is likely that conversations with them will be ongoing in order to continue to position this concentrate in the market.
Zn concentrate |
The following charts show El Brocal’s zinc, gold and silver content in their zinc concentrate when compared to a sample of mines from CRU’s Zinc and Lead Cost Model, looking at data between 2015 and 2019. A sample of 229 mines (out of which 60 are located in Latin America) was used to evaluate standard zinc content in concentrates across the industry, while gold and silver content was evaluated using smaller samples of 63 and 166 mines, respectively.

Figure 16-26: Zn concentrate of El Brocal mine
Source: CRU
| May, 2022 |
SRK Consulting Peru SA SEC Technical Report Summary – El Brocal | Page 265 |
Note: Three mines have an Ag grade of over 1,200g/t. They were omitted for graphic purposes
Buenaventura does not have smelting capacity to process the material, and therefore needs to sell the product to the market.
Total smelting capacity in 2019 was ~15 Mt of zinc per year. Zinc concentrates are mostly sold to Asia, where most of smelting capacity is located. Approximately ~44% of zinc smelting capacity can be found in China, followed by South Korea (~7% of global smelting capacity) and Japan (~4% of global smelting capacity). Outside Asia, other relevant location is Europe, which concentrates 17% of smelting capacity worldwide. Central and South America account for ~4% of smelting capacity, with smelters in Peru and Brazil. Peru has two zinc smelters, La Oroya and Cajamarquilla, with Cajamarquilla being the seventh largest zinc smelter in the world in terms of processing capacity.
Most of the zinc smelters in the world are not integrated. According to our estimates, the customs market volume is estimated to be ~7Mt of zinc concentrates.
Non-integrated smelters are located in all the major zinc consuming regions. Having said that there are some zinc smelters that are located inland such as CIS smelters, which makes them unattractive choice for processing. In Europe and North America, there are smelters that will be more likely to buy concentrates from nearby mines. Nevertheless, there are still smelters that will accept concentrates from overseas mines. The largest customs market is likely to be located in Asia, where there are Japanese, South Korean and Chinese smelters which will operate in the customs market.
Buenaventura’s zinc concentrate from El Brocal has a relatively standard zinc content and high silver content. This is one of the least complex products in Buenaventura’s portfolio and is generally regarded as a product that is versatile and has no problem finding a market. Although the high humidity of the concentrate is the only small element of concern, this does not have an impact on payability. Going forward, Buenaventura has contracts in place with standard buyers committing 82% of El Brocal’s zinc concentrate production in 2022, and 21% in 2023. The business relationship with these buyers is ongoing and negotiations are expected to continue to take place in the future.
Pb concentrate |
The following charts show El Brocal’s lead, gold and silver content in their lead concentrate when compared to a sample of mines from CRU’s Zinc & Lead Cost Model, looking at data between 2015 and 2019. A sample of 191 mines (out of which 57 are located in Latin America) was used to evaluate standard lead content in concentrates across the industry, while gold and silver content was evaluated using smaller samples of 54 and 179 mines, respectively.
| May, 2022 |
SRK Consulting Peru SA SEC Technical Report Summary – El Brocal | Page 266 |
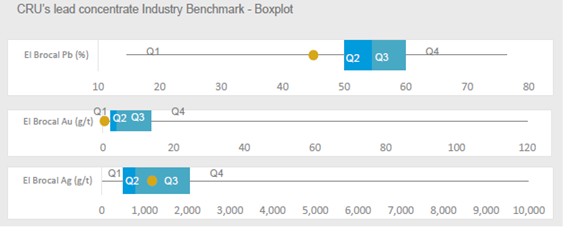
Figure 16-27: Pb concentrate of El Brocal mine
Source: CRU
The lead market is highly reliant on the secondary market to provide the vast majority of refined lead. From 11.8 Mt of refined lead production in 2020, just 4.3 Mt of refined lead came directly from lead mines, equivalent to 37% of production.
Around two thirds of mined lead is produced in China. China does not export any concentrate and remains a substantial importer of lead concentrates, importing around ~700kt of lead contained in concentrates every year. Outside of China, the size of smelter’s custom market purchases is equivalent to ~800 kt Pb contained concentrates annually, which translates into a total custom market for lead concentrates of ~1.5 Mt Pb. In terms of quality preference, most Chinese smelters are not overly interested in processing lead concentrates with high silver because of the silver price arbitrage. The silver price in China is usually lower than international LBMA prices, and a prospective Chinese smelter would have to pay in LBMA terms when buying the concentrate and receive the local price when selling. Notably, there are a few lead smelters which have government permits in place that allow them to process the silver and export it, avoiding price arbitrage in the process. However, this can be done only if the concentrate being imported into China falls under the silver concentrate category. Although the smelters which have the necessary permits to process silver concentrates and then export them are only a few in number, they are relatively large in terms of capacity.
El Brocal’s lead concentrate has a relatively low lead content, with silver content on the higher side. With arsenic content at ~0.4% and taking into consideration the deposit’s overall arsenic levels, arsenic content could lead to the concentrate being blended during certain periods of time. However, this should not present an issue for traders and buyers with experience in this area and, overall, El Brocal’s lead concentrate is regarded as a good quality concentrate which does not present challenges when blending. Going forward, Buenaventura has contracts in place securing sales for 48% of El Brocal’s lead concentrate production in 2022 and 11% of expected production for 2023. The business relationship with these buyers is ongoing and it is likely that negotiations will continue to take place in the future.
| May, 2022 |
SRK Consulting Peru SA SEC Technical Report Summary – El Brocal | Page 267 |
Environmental Studies, Permitting, and Plans, Negotiations, or Agreements with Local Individuals or Groups |
According to Peruvian law, any activity that can cause significant negative environmental impacts must be evaluated prior to execution. A set of commitments about what to do, as well as not to do, is generated to prevent said impacts or to mitigate, remedy, or compensate the same. When the environmental study is approved, commitments become environmental obligations that can be audited, and non-compliance is sanctionable.
Similarly, the national regulation requires mining companies to make a technical and economic proposals for how intervened areas will be rehabilitated to ensure compatibility with the surrounding ecosystem once mining activity ends. This report refers to the Mine Closure Plan (MCP), which is executed during the useful life (progressive closure), and at the end of operations (final closure and post-closure).
The aforementioned management instruments also consider approaches for adequate social relations. Regulations require the mining owner to have a "Social Management Plan", i.e., a set of "strategies, programs, projects, and social impact management measures to be adopted to prevent, mitigate, control, compensate, or avoid negative social impacts and to optimize the positive social impacts of the mining project in their respective areas of social influence." The Social Management Plan is approved as part of the EIAd.
In addition to the commitments that may be established in the Social Management Plan, derived from the social impacts related to project implementation, it is important to note that there are also social commitments that derive from compliance with the "Principles of Social Management" to which all mine owners must adhere, and which are not necessarily related to the social impacts of the project, but are equally enforceable.
In addition to the above, the national regulatory framework requires other permits of a sectorial nature as conditions for the commencement and development of mining activities (permits from the Ministry of Energy and Mines), such as for the use of other natural resources, protection of natural heritage or culture, among others.
Below, we report on the performance of the Colquijirca MU regarding the aspects described above, pointing out the problems identified, if applicable.
Environmental Study Results |
Activities at Colquijirca were initially subject to an Environmental Adjustment and Management Program (PAMA), which was the primary environmental management instrument in place when the mine began operations. Subsequently, several preventive environmental studies were approved for various areas of the mining activity, as well as amendments to the same (either through amendments, Supporting Technical Reports -STR-, or prior communications).
SRK has confirmed that the Colquijirca Unit’s PAMA was approved by the regulatory authority in 2002. Subsequently, that mine received approval for several EIAs for different components and expansions of the operation (2001, 2004, 2008, 2011, 2014; amendments to these studies (2012); and complied with minor or environmentally non-significant variations of the STR (2016, 2017, 2018, 2019, and 2021) as well as with elements of prior communications.
| May, 2022 |
SRK Consulting Peru SA SEC Technical Report Summary – El Brocal | Page 268 |
Additionally, SRK has observed that the unit took advantage of all the opportunities provided by the regulation to regularize some components or activities that at the time may not have been covered by the aforementioned environmental studies. This was the case with the approval of a Detailed Technical Report (2017), and currently, a Detailed Environmental Plan (PAD) under evaluation.
After reviewing the descriptive scope of the documents identified above, SRK has concluded that the main activities and components for mining and beneficiation at Colquijirca MU have obtained statutory Environmental Certifications. SRK has come to the same conclusion regarding the ancillary components of the mine.
Project permitting requirements, the status of any permit applications, and any known requirements to post performance or reclamation bonds |
Other permits required by other sectoral authorities. 1 |
SRK found that Colquijirca MU possesses permits beyond the environmental and sectoral permits mentioned above. These authorizations are of utmost importance to the development of mining activities, and include:
a) | For the use of water resources |
The unit has water use rights to meet its operational needs, both for human consumption (DWTP in the Colquijirca and Huaraucaca areas; staff camp, Camp's Pavilion G, Huaraucaca offices, etc.) and for industrial mining purposes.
The water uses licenses to which SRK had access show the following water sources: Angascancha Lake; turbined water from the Jupayragra hydroelectric plant; the Smelter cavern; and the Pun Run Lake.
b) | For discharge into water resources |
The mine owner declares that “discharges occur solely at WWTPi, Huaraucaca DWWTP, and Jupayragra Power Plant”, which are covered by the corresponding authorizations, such as Directorial Resolution No. 187-2019-ANA-DCERH dated November 13, 2019, which extends the validity for 3 additional years (until August 7, 2022); Directorial Resolution No. 010-2021-ANA-DCERH dated January 28, 2021, which extends the discharge authorization for 3 additional years computed from August 4, 2020 (until August 4, 2023); and the energy water discharge authorization, granted by Directorial Resolution No. 1909-2005-DIGESA-SA dated December 16, 2005. This discharge authorization remains in force given that on the date it was granted, the regulation established that its term would be indicated in the resolution, and no such term was established.
1 The access provided by Sociedad Minera El Brocal to this information was very limited. Most of the information gathered for this section was obtained through the online institutional websites of administrative authorities in Peru.
| May, 2022 |
SRK Consulting Peru SA SEC Technical Report Summary – El Brocal | Page 269 |
c) | For Drinking Water Treatment Plants |
Regulations require that the water provided for human consumption meet specific conditions for quality. To this end, DWTPs must have the corresponding sanitary authorization for the water treatment system. SRK verified that said authorization has been obtained for the Colquijirca mining camp and the Huaraucaca mining camp DWTPs.
d) | For the installation and operation of septic tanks |
SRK has also verified that the mine received sanitary authorization for septic tanks and land infiltration in 2011.
e) | For the protection of cultural heritage |
SRK verified that the operation possesses a Certificate of Non-existence of Archaeological Remains for the Colquijirca Unit, Huachuacaja area, and Marcapunta
Mining operating permits issued by sectoral mining authorities. |
a)For mining and ancillary activities
From the review of available documents, SRK was able to corroborate that the Colquijirca MU has mining rights for its mining and ancillary activities and possesses the corresponding operating permit from the mining authority.
Mining rights are grouped in the Acumulación Pariachuccho, as per Resolution No. 02362-2004-INACC/J, with an extension of 2,179.1378 hectares.
Colquijirca MU began work years back, when no “authorization to start mining activities” was required. The mine has, however, obtained the necessary permits to intervene in new areas or to resume activities in previously intervened areas. An example of the latter is the Marcapunta Norte Mine, where activities resumed in 2008.
In addition, SRK has reviewed documentation to verify the company’s compliance with requirements to communicate mining plans for the years 2018, 2019, 2020, and 2021.
b)For beneficiation and ancillary activities
SRK’s review of available documents corroborates that the Colquijirca MU has the corresponding permits to develop its mining beneficiation activities.
The "Huaraucaca" beneficiation concession was approved by Directorial Resolution No. 143/83. Subsequently, extensions, amendments, and communications have been processed as required by the regulations in force at each opportunity.
Over time, the processing capacity of the Huaraucaca beneficiation plant has gone from 1000 MT/day (1991) to the current capacity of 21,600 MT/day, as authorized by the Mining Technical Report (2016) that raised the expansion of the previously installed capacity by 18,000 MT/day, approved by Resolution No. 0562-2016-MEM-DGM/V and supported by Report No. 275-2016-MEM-DGM-DTM-/PB.
| May, 2022 |
SRK Consulting Peru SA SEC Technical Report Summary – El Brocal | Page 270 |
Mine closure plans, including remediation and reclamation plans, and associated costs2 |
Colquijirca MU's activities comply with the legal requirement of having presented measures for the progressive, final, and post-closure of its existing and planned components. Thus, the approval of an initial MCP in 2009 has been corroborated, as well as its update in 2012, modification in 2016, and a second update in 2019.
SRK has verified that semiannual reports for the years 2018, 2019, and 2020 have been submitted to authorities and that said reports provide details on progressive compliance with the MCP.
It should be noted that the schedule of closure activities included in the MCPs, or their amendments must be met to avoid administrative sanctions and triggering financial guarantees if progressive closure budgets are not executed.
From the information contained in the Semiannual Mine Closure Plan Compliance Reports, SRK has concluded that the following progressive closure works are potentially delayed or non-compliant with respect to the approved Mine Closure Plan:
| ● | Unish waste dump physical and geochemical stability works - Planned as a closure activity for the first half of 2020. |
| ● | Santa Maria waste dump physical and geochemical stability works - Planned as a closure activity for 2021. |
| ● | Drilling rig disassembly, physical stability, and geochemical stability works (74) - Closure completed in 2020. |
| ● | Livestock Improvement Program, Environmental Education & Training Program, and Monitoring Training - Social programs completed by 2021. |
These delays could be justified under the state of health emergency due to COVID -19, declared in Peru by Supreme Decree No. 008-2020-SA, effective March 12, 2020.
Social relations, commitments, and agreements with individuals and local groups. |
The area of direct social influence is made up of the communities of Huaraucaca, Villa de Pasco, Santa Rosa de Colquijirca, Smelter, Ucrucancha, Vicco, and the community of Colquijirca in the district of Tinyahuarco, whose main activity is urban-rural trade, basically with the MU, to which they provide services. On a much smaller scale, some communities engage in livestock farming.
Due to the COVID-19 pandemic, the 2020 and 2021 Social Management Plans as well as the Programs and sub-programs of the current Environmental Management Instruments (IGA) have
2 For the preparation of this report, verification of compliance with environmental obligations, including mine closure measures, was performed at documentary level only. In our experience, documentary verification of compliance with environmental obligations is very limited, because many areas and components that could generate potential environmental contingencies or problems are not mentioned in any official document, and often there are no documentary references to them.
| May, 2022 |
SRK Consulting Peru SA SEC Technical Report Summary – El Brocal | Page 271 |
been rethought and executed and are recorded in the Mining Unit's follow-up or monitoring matrix of commitments and obligations. This matrix has been reviewed for this analysis.
The objective of the programs and sub-programs is to strengthen the mining unit's ties with the community population and local authorities for a sustainable relationship that will allow for future acquisition of land for mining operations by strengthening social relations and the company's reputation. In this regard, the company seeks to improve its relationship by addressing the demands for housing repairs in Colquijirca, response to complaints and claims, and compliance with the framework agreement and replacement works.
The current social management plan of Colquijirca Mining Unit - El Brocal - BUENAVENTURA S.A.A. includes instruments in place prior to the unit’s acquisition in 2018, but some goals have been rescheduled due COVID-19 and to reflect the company’s desire to strengthen social relations by fulfilling obligations and commitments acquired with the population of the area of interest and direct/indirect influence. When Corporación Buenaventura purchased El Brocal, it assumed commitments made by the previous owners to ensure that good social relationships are obtained.
Of the 45 obligations reviewed, 73% have been executed within the time and budget allocated prior ot the initiation of the progressive closure stage. Slight delays in execution are attributable to COVID-19 restrictions and social distancing requirements, which impeded the execution of a number of social initiatives. To avoid contagion, participatory training and monitoring, for example, could not be conducted; this is reflected in the weighted progress.
The COVID-19 context has weakened community relations and the ADSI and AISI have been unable to conduct planned visits to the community. It is clear that the Social Affairs Area of the mining unit requires more support to implement its strategy, which seeks to strengthen and improve community relations to lay the groundwork to acquire land or areas of interest to expand the Colquijirca mining operation down the line.
In general, Colquijirca Mining Unit - El Brocal - BUENAVENTURA S.A.A., complied with the practice of reporting on the social components in accordance with regulation SK-1300.
Mine Reclamation and Closure |
Closure Planning |
El Brocal’s closure plan has been approved by the mining authority, which deemed that all corresponding regulatory requirements had been met. Although this plan is fairly detailed, most of the proposed plan does not comply with CDC and ICMM Guidelines. SRK is of the opinion that most of the actions proposed have been defined at the conceptual level given that detailed engineering has yet to be performed. Nevertheless, the objective of this technical memo is not to describe components and closure activities in detail. The general closure actions for the project components that pose the greatest risks and represent the largest costs are summarized below. Closure of other facilities, such as civil infrastructure, demolition of structures and buildings, quarries and landfills are considered in the closure plan, but are not addressed herein.
Closure actions proposed in the closure plans for the key facilities are summarized below and some aspects are discussed in more detail in the following sections.
| May, 2022 |
SRK Consulting Peru SA SEC Technical Report Summary – El Brocal | Page 272 |
Underground Openings
The operation includes eight portals, and thirty-three shafts. The closure action for the portals is to construct a reinforced concrete bulkhead with varying thicknesses (1.5 to 6.5 meters approximately) depending on the type of portal, filled with waste material until surface.
The shaft openings will be closed with a concrete cap, which will be covered with low permeability and revegetated. Hydraulic plugs are proposed for some the underground openings, based on the 5 failure modes criteria. These openings are: (1) Unish, (2) Santa María, (3) Tajo Sur, (4) North Marcapunta (also called Main Ramp), and (5) Negative ramp.
All structures associated with the underground openings will be demolished and dismantled.
Waste Rock Dumps
All mine waste rock dumps (WRD) will be reclaimed during operation, as part of progressive closure activities. The only WRD that will remain after closure is Condorcayán WRD.
The proposed closure actions for the waste rock dumps include construction of diversion channels, placement of a low permeability cover and revegetation. Slopes will remain at angle of over (~1. 75H:1V), which is considered stable for the height of the dump (27m).
The locations of the topsoil stockpiles will be regraded and revegetated after the topsoil is used for closure of other areas of the site.
Tailings Impoundments
SMEB has two tailings storage facilities: (1) Huaraucaca and (2) Huachuacaja deposits.
Huaraucaca deposit is formed by the conjunction of 7 different deposits (deposits N°1 to 7). Deposit N°7 was built over deposits N°3 and N°5; and deposit N°4 is proposed to be mined through conventional excavation as well as hydraulic mining. The tailings generated through this process are considered to be deposited on Huachuacaja deposit. This deposit is going to be closed as part of progressive actions.
The proposed closure actions for this deposit include placement of a low permeability cover and revegetation, and the construction of contact water diversion channels. Current perimetral diversion channels are considered to be kept for closure. Slopes will remain at an angle of over (~1.87H:1.0V), which may vary over the different section of the deposit.
Huachuacaja deposit is conceived as a conventional deposit supported by a main dam constructed with different types of materials (zoned dam). This deposit will be closed as part of the final closure. Closure activities for this deposit include placement of an impermeable cover (geomembrane + 0.3m gravel + 0.15m topsoil) and revegetation, tailings impoundment profiling towards out of the deposit, and diversion system constructed over the cover, composed by a main and secondary channel that will discharge to two ponds and later to the creek.
All structures associated with the tailing’s deposits will be demolished and dismantled.
| May, 2022 |
SRK Consulting Peru SA SEC Technical Report Summary – El Brocal | Page 273 |
Progressive Closure
Included in the closure plan for El Brocal is a commitment to progressively close activities or facilities as they are no longer needed for operations. To date, the following facilities have been, or are planned to be progressively closed in advance of final closure.
| ● | Four portals: (1) Unish, (2) Santa María, (3) Borgez, and (4) Gregorio. |
| ● | Thirty-three shafts. |
| ● | Six Waste Rock Dumps: (1) Condorcayán, (2) South, (3) Unish, (4) Santa María, (5) Borgez and (6) San Gregorio WRD. |
| ● | One tailings deposit: (1) Huaraucaca deposit. |
| ● | North pit (also called Mercedez pit). |
| ● | Concentrator plant N°1. |
| ● | Two drinkable water treatment plants: (1) Colquijirca, (2) and Huaraucaca plants. |
| ● | Three topsoil deposits: (1) Huachuacaja, (2) Huaraucaca, and (3) Colquijirca 1 deposits. |
| ● | Tailing’s thickener plant. |
| ● | Two hydroelectrical plants (old facilities): (1) Río Blanco, and (2) Jupauragra plants. |
| ● | Underground powder keg. |
Closure Cost Estimate |
The estimated closure cost has been based on the approved closure plan and the results of the additional physical and chemical stability studies performed by SRK during this project. SRK has prepared revised closure cost estimate incorporating the relevant gaps and an update a number of closure activities. Therefore, this chapter describes cost associated and a comparison between the estimate and the approved closure plan of El Brocal.
SRK focused the closure cost update to focus on the most significant cost components, which comprise approximately 80 percent of the total existing or updated costs. This analysis reviewed and, as necessary, updated quantities and unit costs based on the existing information and SRK’s experience.
The analysis of the most significant closure activities was developed based on an update of the productivities and unit prices related to the labor, equipment and material. This analysis and update was based on published cost data.Peruvian Chamber of Construction CAPECO (in its Spanish acronym) and internal SRK data from similar projects.
In updating the closure costs, SRK made the assumptions due to limited information available.
| ● | The MTO are preserved from the approved closure plan |
| ● | In cases where the estimated unit prices were updated and represent a lower price than the approved closure plan, SRK conservatively used the unit price presented in the closure plan. |
| May, 2022 |
SRK Consulting Peru SA SEC Technical Report Summary – El Brocal | Page 274 |
Table 17-1: UM El Brocal closure cost comparison
Description | Closure Plan | Update Closure Cost | Percentage | |||
-2020 | -2021 | |||||
Progressive Closure | Final Closure | Progressive Closure | Final Closure | Progressive Closure | Final Closure | |
(USD) | (USD) | (USD) | (USD) | (%) | (%) | |
Direct cost | 72,002,191 | 14,204,968 | 134,468,482 | 19,061,588 | 87% | 34% |
Indirect cost | 18,000,548 | 3,551,242 | 14,739,148 | 8,709,855 | -18% | 142% |
Contingency (1) | 3,600,110 | 710,248 | 22,381,145 | 4,165,716 | - | - |
Total (without Taxes) | 93,602,849 | 18,466,458 | 171,588,775 | 31,937,159 | 83% | 73% |
Source: SRK
(1) Contingency estimated as: 5% of direct costs on current closure plan, and 15% on SRK’s updated costs.
Post-Closure Costs
Post-closure activities were presented in the approved closure plan. SRK, through is experience and internal data base has updated the cost related to monitoring and maintenance five years. SRK updated these costs based on professional experience and internal databases but did not increase the length of the monitoring and maintenance period. The results are presented in the following Table 17-2.
Table 17-2: post-closure approved closure plan and update (2021)
Type | Description | Approved Closure Plan (2020) | Update Closure Cost (2021) | Percentage |
(USD) | (USD) | (%) | ||
| Physical Maintenance | 44,947 | 60,438 | 34% |
Geochemical Maintenance | 35,669 | 60,438 | 69% | |
Hydrological Maintenance | 35,669 | 36,916 | 3% | |
Biological Maintenance | 35,669 | 52,885 | 48% | |
Monitoring | Physical Stability & Air Quality Monitoring | 81,976 | 81,976 | 0% |
Geochemical Stability Monitoring | 25,887 | 25,949 | 0% | |
Hydrological Stability Monitoring | 25,887 | 25,887 | 0% | |
Biological Stability Monitoring | 25,887 | 33,089 | 28% | |
Social Monitoring | 116,090 | 126,950 | 9% | |
Direct Cost | 427,681 | 504,528 | 18% | |
Indirect cost | 106,920 | 266,413 | 149% | |
Contingency | 21,384 | 115,641 | 441% | |
Total (without Taxes) | 555,985 | 886,582 | 59% |
Source: SRK
(1) Contingency estimated as: 5% of direct costs on current closure plan, and 15% on SRK’s updated costs.
| May, 2022 |
SRK Consulting Peru SA SEC Technical Report Summary – El Brocal | Page 275 |
Limitations on the Current Closure Plan and Cost Estimate |
Limited information was available in the approved closure plan and cost estimate regarding closure material quantities and how they were calculated. Because of the limited information available, particularly the lack of details as to how those costs were calculated basis for the unit rates, SRK cannot validate the cost estimate in the approved closure plan.
However, in order to assess the impact of changes in unit prices, SRK used the quantities and key parameters (e.g., topsoil haul distances and cover material thicknesses) that were included in the approved closure plan and assumptions where details were absent, and applied current unit rates for labor, equipment, and materials to those quantities. For example, the cost to excavate, haul and place low permeability cover material did not indicate how far the material would be hauled. In this case, we used published and internal equipment and labor rates, and estimated an average haul distance to update the cost.
Afterward the identification of the geographic aspect and coefficient related that are key to discover the unified prices for the estimate (September 2021). The variant factor is the divergence between the unified prices recently updated and the closure plan (March 2020). Then the mentioned unified rates will be multiplied by an influence percentage that is weighed by importance. Finally, the average factor is calculated has a summary of every activity. For El Brocal, the resulting average factor is 1.30.
Material Omissions from the Closure Plan and Cost Estimate |
Based on our review of the available data, SRK has observations with respect to predicting and designing closure actions to manage the long-term physical stability of the site. The results of the stability analyses indicated that all analyzed slope configurations satisfied the minimum static and pseudostatic FOS criteria set in the study (static FOS=1.5; pseudostatic FOS = 1.0). SRK makes the following observations with respect to the available stability analyses:
| ● | In most cases the established seismic loading and stability criteria satisfy Peruvian national regulations and are typically accepted for studies using operating-basis earthquake loading but should be reviewed and revised depending on the guidelines Buenaventura decides to adhere to in demonstrating long-term closure stabilization. |
| ● | Buenaventura should demonstrate the ability to revegetate and maintain slopes at 1.7H:1V for long-term closure conditions or allow for regrading to a flatter and more erosionally stable configuration. |
| ● | The stability analyses completed to date consider different seismic accelerations, each of which appear to satisfy current Peruvian national regulations, but none of which satisfy the passive-closure recommendations in the Global Industry Standard on Tailings Management. If Buenaventura decides to comply with this relatively new standard, additional design and stabilization work will be required to ensure the facilities meet the seismic criteria of the GISTM, possibly including the construction of compacted fill buttresses to increase embankment stability under 1/10,000-year seismic loading. At the very least, a consistent approach to determining and applying the seismic hazard across the site should be developed and applied to all proposed closure configurations to facilitate a consistent approach to closure stabilization design. |
| ● | Slopes to be covered should be analyzed using the infinite slope method to demonstrate long-term closure stability of the cover layer. |
| ● | Records of tailings and waste rock dump seepage were not available. Phreatic conditions within the TSFs and WRDs are generally unknown and should be modelled for the closure |
| May, 2022 |
SRK Consulting Peru SA SEC Technical Report Summary – El Brocal | Page 276 |
configuration to facilitate accurate stability analyses and predictions of long-term draindown flows.
| ● | Geochemical characterization of tailings and waste rock was also not available but should be developed to facilitate long-term water quality modeling to inform the short and long-term. |
Based on a review of the closure plan and costing associated with cover soil acquisition and placement, SRK makes the following observations:
· | There are three topsoil stockpiles identified, but there is no sitewide cover and borrow material balance to show which facilities need cover and how much. |
· | The proposed TSF cover includes placement of a 15cm thick layer on top of geotextile over geomembrane. It is extremely difficult to place a layer of soil this thin consistently over large areas and will be even more difficult over a geomembrane without damaging the liner. Required drain rock volumes should be adjusted to accommodate a minimum thickness of 15 or 20 cm (as applicable) with some portion of the layer placed thicker, and placement costs should envision the use of small low-ground-pressure equipment. |
· | Waste rock dump and tailings embankment slopes are unlikely to be sufficiently stable, particularly against erosion, for long-term closure conditions. |
Based on our review of the available geochemistry data, SRK has observations with respect to predicting and designing closure actions to manage the long-term chemical stability of the site and potential impacts to the surrounding environment, specifically downstream water resources.
· | There is currently no post-closure water balance or predictions of future water quality at El Brocal. These are required to fully determine the nature of water treatment required post-closure. SRK have made high-level predictions of flows, that have a level of uncertainty. |
· | The site climatic conditions, the available water quality data, and fact that the site currently treats water prior to discharge indicates that water treatment will be required after closure to meet downstream water quality objectives. Based on data reviewed SRK anticipate that even with the closure actions proposed, including covers on mine waste facilities, untreated discharge water from the site will result in continued exceedances of the applicable standards. |
Water treatment is currently carried out at the site and comprises of HDS. Because water is treated operationally, SRK’s experience indicates that water treatment would also likely be required post-closure. Although detailed geochemical analysis has not been conducted and predictive numerical calculations have not been produced to determine future water quality predictions, the nature of the geology and mine waste materials at El Brocal indicate that acid rock drainage and metal leaching (ARDML) is likely to be an issue post-closure. Available geochemistry results indicate that the majority of waste rock is non-PAG although in contrast the majority of the tailings is classified as PAG. Satellite imagery from site indicate visual impacts of ARDML for the open pit and TSF. |
Water Treatment Capital Cost
Because post-closure water treatment was omitted from the current closure cost and SRK has determined that the available data indicate that this will be required, SRK has prepared a high-level estimate of the capital costs to utilize the existing HDS water treatment plant during closure. For this, SRK have assumed that only an additional filter press will be required. SRK have also included sustaining Capex costs for capital upgrades after 5 years post-closure and beyond, to include maintenance, replacement of parts and likely to reduce capacity of the treatment plant as it will be oversized. Operating costs are included as a post-closure cost.
The capital cost estimate includes only the addition of a filter press to the current WTP.
| May, 2022 |
SRK Consulting Peru SA SEC Technical Report Summary – El Brocal | Page 277 |
The capital cost estimate (CAPEX) has been prepared by using previously received quotations for the major equipment associated with HDS plants, scaling these appropriately and adjusting for inflation. Due to time constraints, no new quotes have been sought as part of this project.
Table 17-3: Water Treatment Capex
Item | HDS WTP Cost (USD) |
|---|---|
Equipment – Filter Press | 1,200,000 |
Sub Total | 1,200,000 |
10% Contractor Profit | 120,000 |
Total | 1,320,000 |
Source: SRK
The sustaining CAPEX has been split into annual values for the first 5 years post-closure and subsequent to this time in perpetuity. The first five years of sustaining Capex has been included to make an allowance to make necessary modifications to the existing HDS WTP, including any repair and maintenance that is required and the downsizing of the facility. This initial sustaining Capex is estimated at USD 500,000. Subsequent to this period, sustaining Capex is estimated to be USD 250,000 annually to cover maintenance, repair and replacement on the assumption that a design life of 20 years is obtained by the modifications/upgrades at year 5.
Water Treatment Operating Cost
Annual operating costs for the WTP are based on average annual flows that require treatment. The WTP will be required in perpetuity. Table 17-4 provides a combined annual Opex cost that combines both the operation of the WTP, subsequent sludge management, and sustaining Capex.
Table 17-4: Total Water Treatment Costs Annual Summary
Item | Years 0-3 | Years 3-5 | Years 6-10 | Years | Years 14> |
WTP Opex | 5,900,000 | 1,700,000 | 830,000 | 500,000 | 2,400,000 |
Sludge Mgmt. | 3,300 | 1,000 | 1,000 | 1,000 | 1,650 |
Sustaining Capex | 500,000 | 500,000 | 250,000 | 250,000 | 250,000 |
Total (US$) | 6,403,300 | 2,200,000 | 1,081,000 | 751,000 | 2,651,650 |
Source: SRK
Adequacy of Plans |
Environmental |
No significant issues have been identified with respect to the Colquijirca MU Mine Closure Plans. However, the following are some aspects to which attention should be paid in order to avoid generating contingencies in relation to mine closure:
| ● | Plan in advance the submission of the MCP Update (the next one would be due in 2024). |
| ● | Ensure that the commitments made for progressive closure have been fulfilled, otherwise there could be administrative sanctions (payment of fines) and the requirement to provide a financial guarantee for an amount equivalent to the budget of unfulfilled progressive closure measures. |
| May, 2022 |
SRK Consulting Peru SA SEC Technical Report Summary – El Brocal | Page 278 |
Local Individuals and Groups |
Of the 45 obligations reviewed, 73% have been executed within the time and budget allocated, before starting the stage of progressive closure, noting that the slight delay in execution is due to the COVID-19 context and the nature of these imminently social activities. Participatory training and monitoring, for example, could not be carried out to avoid the risks of contagion, which has been reflected in the weighted progress.
While it is true that this COVID-19 context has weakened community relations due to the lack of visits to the ADSI and AISI, it is also true that the Social Affairs Area of the mining unit should have more support to implement the strategy developed by the Social Affairs team that seeks to strengthen and improve community relations, in order to meet future goals of acquisition of land or areas of interest for the expansion of the Colquijirca mining operation.
Mine Closure |
Hydrogeology
| ● | Post-mining simulations should be improved in the next level of studies for an accurate estimate of the main hydrogeological parameter designs (water levels, groundwater flows and rebound timing). Transient calibration and sensitivity analysis need to be included. |
Hydrogeology and Stormwater Management
| ● | Fully document the methods and assumptions used in the hydrologic analysis to determine design storm peak flow rates. |
| ● | Document the design criteria and how they align with Buenaventura’s chosen final closure criteria (CDA, GISTM, etc.). |
| ● | Develop accurate construction costs using local or regional contractors to update the pricing and cost estimate. |
| ● | Evaluate the potential for erosion of Huaraucaca TSF embankment slopes bounding the Rio San Juan and the risk of erosion of slope toes, transport of tailings solids, and potential slope oversteepening and instability. Develop appropriate designs to ensure long-term erosional and mass stability under predicted closure conditions. |
Cover Design
| ● | A detailed cover and borrow soil material balance should be prepared to determine exactly how much of each material type is required, where the material will come from, and then each material should be characterized for geotechnical, hydraulic, and geochemical properties to support infiltration modeling (if necessary), closure water balance development, and chemical modeling. |
| ● | Cover costs should be adjusted as necessary to account for the results of the detailed material balance, and the specified source for each material. |
Physical Stability – TSFs and Waste Rock Dump
| ● | Review and revise FOS criteria based on selected guideline for demonstrating long-term closure stabilization. |
| ● | Complete sitewide seismic hazard assessment and apply consistently to all slope stability analyses. |
| May, 2022 |
SRK Consulting Peru SA SEC Technical Report Summary – El Brocal | Page 279 |
| ● | Review and revise closure designs, construction materials, and slope stability analyses to ensure long-term stability of all construction components. |
| ● | Evaluate phreatic conditions within WRDs and TSFs and develop a sitewide water balance model incorporating all predicted flows and informing the potential need for post-closure water treatment. |
Chemical Stability – Geochemistry
The available geochemistry test work data indicates that most of the waste rock at El Brocal is non-PAG. In contrast, most of the tailing’s material is indicated to be PAG. Aerial imagery of the site indicate ARDML impacts in the open pit and TSF. Collectively, the evidence suggests a significant potential for ARDML impacts. This is further supported by that fact that at El Brocal contact waters are treated to comply with mine discharge permits.
Based on the review of the existing information and identified gaps, SRK have concluded that:
| ● | The lack of inclusion of post-closure water treatment provision in the 2018 CCE is a significant omission. As water treatment is required operationally, SRK have assumed that it will be required post-closure. |
| ● | As predictions of future water quality and flows (i.e., a water balance) are not available, SRK have assumed that water treatment will be required in perpetuity, with the chemistry remaining of similar type to that observed operationally. SRK prepared estimates of flows for the WRD and TSF to facilitate this work, but these have an associated degree of uncertainty. BVN have provided estimates of post-closure flows associated with open pit water decant to the receiving surface water environment |
| ● | SRK has proposed continued use of the existing HDS WTP with an allowance for sustaining capex for maintenance, repair and replacement which will also include downsizing given that the current WTP is oversized for predicted post-closure flows. To minimize sludge handling volumes and costs, a filter press is incorporated into the WTP. This will minimize sludge volumes and create a more stable sludge, making handing easier. Sludge generation rates and stability in post closure will become very important as the minimum area of the TSF will be kept open to receive the sludge. |
A number of assumptions have been made in order to develop the conceptual level water treatment cost estimate. To refine and improve this cost estimate, SRK recommend that the following work is carried out as soon as possible.
| ● | Geochemical characterization of mine waste materials and subsequent predictive numerical geochemical modelling to determine likely future water quality associated with the TSF, WRD, the open pit and underground discharges (should future discharges flows associated with the latter change). Based on SRK’s review of the available geochemistry information, it is likely that samples of mine waste material will be required to be submitted for humidity cell test work (HCT) to determine long term metal release rates and reactivity with time. Based on SRKs experience of this type of work, it is anticipated that approximate costs for this predictive numerical modelling would be in the order of US$150,000 - US$200,000 for professional fees, not inclusive of third-party external disbursements such as analytical test work, borehole drilling, site investigation etc. |
| ● | The development of a post-closure water balance that will define the flow rate through time associated with the underground mine, the open pit, the TSFs and WRDs. Current numerical groundwater and hydrological models needs to be updated and recalibrated in order to predict post-closure hydrogeological and hydrological conditions, aiming a more accurate estimates of groundwater flows in the mine, water levels, and rebound timing to be used in the post-closure water balance. The cost of the groundwater numerical simulations would be around US$100,000 to US$125,000. |
| ● | Detailed studies to determine the feasibility and costs associated with pumping and gravity feeding water from the TSF to the existing WTP location. Preliminary calculations indicate |
| May, 2022 |
SRK Consulting Peru SA SEC Technical Report Summary – El Brocal | Page 280 |
that this would be favorable in comparison to building and operating a separate WTP for this facility, but this needs to be fully determined.
Depending on the results of the above, further assessment of the post-closure treatment options would be required. Depending on the type of chemistry and flows predicted this would be expected to cost between US$50,000 - US$150,000 excluding external disbursements such as analytical test work. The exact scope of this work cannot be determined, but may include, options appraisals, trade off studies, obtaining third party vendor costs for active water treatment and the piloting testing of passive water treatment options where appropriate.
Closure Costs
Details of quantities in the estimate were not traceable and the absence of information made it difficult to identify or update. This should be improved in the next S-K 1300 update.
· | The need for, and the cost estimate of water treatment plants should be assessed in more detail in future studies, to better understand and optimize closure activities regarding water management. |
· | Material balance for covers should be reviewed. Material source’s location and cover material characterization should be developed and identified, to optimize placement costs and to improve their accuracies. |
· | Once the closure and post-closure activities are reviewed and updated in the closure plan, the requirements and length of time needed for post-closure monitoring and maintenance should be revised to accommodate those changes. |
Commitments to Ensure Local Procurement and Hiring |
Several programs and objectives with commitments to hire local labor and purchase or acquisition of local suppliers were reviewed from sources such as the current environmental management instruments (IGAs).
Commitments to ensure the hiring of local labor |
| ● | As part of Amendment of the Environmental Impact Study of the project “Construction of tailings deposits No. 6 and No. 7 - Regrowth and Expansion of Integrated Deposit No. 7: |
Local Employment Program. Subprogram: Recruitment of local labor. Current status 100% executed. The budget is within the HR area who have the “Ruwana” contract in their costs.
| ● | Amendment of the Environmental Impact Study of the Expansion of Operations Project to 18,000 TMD: |
Local Employment Program. Recruitment of local labor from Santa Rosa de Colquijirca communities. 100% executed.
| ● | Environmental Impact Study of the North and South Marcapunta Mine: |
Recruitment of local labor from Santa Rosa de Colquijirca communities. 100% executed.
Commitments to ensure local procurement |
| ● | As part of the Amendment of the Environmental Impact Study of the project “Construction of tailings deposits No. 6 and No. 7 - Regrowth and Expansion of Integrated Deposit No. 7: |
Program for the acquisition of local products. Which aim to:
| o | Maximize opportunities to purchase products at the local and regional level. |
| May, 2022 |
SRK Consulting Peru SA SEC Technical Report Summary – El Brocal | Page 281 |
| o | Minimize local expectations in reference to potential local purchases of products, adjusting expectations to the existing local and regional offer, maintaining competitive prices. |
| o | It does not have a specific budget; purchases are made by the warehouse area. |
| ● | Amendment of the Environmental Impact Study of the Expansion of Operations Project to 18,000 TMD: |
Clearly explain to the community stakeholders the level of additional demand that the company will generate, as well as the duration of this demand and the possible subcontractors that will be in charge of these community purchases. 100% executed.
No further information about results of hiring local people or local procurement were found.
| May, 2022 |
SRK Consulting Peru SA SEC Technical Report Summary – El Brocal | Page 282 |
Capital and Operating Costs |
Estimation of capital and operating costs is inherently a forward-looking exercise. These estimates rely upon a range of assumptions and forecasts that are subject to change depending upon macroeconomic conditions, operating strategy and new data collected through future operations. For this report, capital and operating costs are estimated at PFS-level with a targeted accuracy of +/-25%. However, this accuracy level is only applicable to the base case operating scenario and forward-looking assumptions outlined in this report. Therefore, changes in these forward-looking assumptions can result in capital and operating costs that deviate more than 25% from the costs forecast herein.
SRK has reviewed and analyzed the following aspects:
| ● | Historical operating costs from 2018 to 2020, including a detailed analysis of the cost database and compilation of costs for forecast estimation; |
| ● | Projected capital cost for the LOM of El Brocal, including sustaining CAPEX |
Capital and Operating Cost Estimates |
Operating Costs |
The forecast LoM operating unit costs are summarized in Table 18-1.
A contingency of 10% was considered for the operating cost to cover any unpredictable factor or variation in the future cost with regard to the historical cost used for forecast estimation.
Table 18-1: Operating cost estimate
Item ** | Units | Forecast | Forecast cost * |
Mining Open Pit |
|
|
|
Waste | US$ / t waste | 1.70 | 1.87 |
Ore | US$ / t ore | 2.11 | 2.32 |
Mining Underground |
|
|
|
R&P Primary | US$ / t ore | 25.34 | 27.88 |
R&P Remanent | US$ / t ore | 26.50 | 29.15 |
R&P Pillar Recov | US$ / t ore | 26.66 | 29.33 |
SLS | US$ / t ore | 28.64 | 31.51 |
Plant Processing |
|
|
|
Plant 1 (Cu) | US$ / t processed | 15.88 | 17.47 |
Plant 2 (PbZn) | US$ / t processed | 14.80 | 16.28 |
G&A Mine Operations | US$ / t processed | 6.22 | 6.84 |
Sustaining CAPEX |
|
|
|
Mining | US$ / t ore | 1.25 | 1.38 |
Processing | US$ / t processed | 2.08 | 2.29 |
Off Site Cost (Corporate) *** | M US$ / year | 8.14 | 8.14 |
Other costs |
|
|
|
Incremental cost **** | US$ / bench - t rock | 0.010 | 0.011 |
Voids research ***** | US$ / t rock | 6.85 | 6.85 |
Source: Buenaventura | |||
| May, 2022 |
SRK Consulting Peru SA SEC Technical Report Summary – El Brocal | Page 283 |
* Some items, depending on cost type, do not include a contingency |
** Estimation does not include selling expenses and some commercial costs stated by the contract with the trader. These costs are included directly in the Cashflow |
*** Average forecast corporate cost (2022-2032) attributable to El Brocal mining unit |
**** Estimated for a bench height of 6 m |
***** cost is applied only to blocks adjacent to zones with the potential existence of voids |
18.1.2 | Capital Costs |
Capital costs were estimated by Buenaventura based on infrastructure and investment requirements for the LoM plan.
A contingency of 15% was considered for the capital cost to cover any unpredictable factor or variation.
Capital costs for the LoM are summarized in Table 18-2. SRK does not have any additional details about the yearly amounts to support or conduct a detailed analysis on specific infrastructure or components,
Table 18-2: Capital cost estimation
Year | Capital cost (M US$) |
2022 | 46.66 |
2023 | 40.00 |
2024 | 56.90 |
2025 | 43.50 |
2026 | 24.80 |
2027 | 10.50 |
2028 | 16.10 |
2029 | 21.40 |
2030 | 12.00 |
2031 | 10.00 |
2032 | 7.10 |
2033 | 0.00 |
Total | 288.96 |
Source: Buenaventura
Closure Cost |
SRK has developed an estimation cost for the three stages of the closure process and an estimated cost for the water treatment system, covering the following aspects:
| ● | Progressive closure |
| ● | Final Closure |
| ● | Post Closure |
| ● | Water treatment |
A contingency of 15% was considered for the closure cost to cover any unpredictable factor or variation.
The total closure cost distributed up to the year 2053 is 230.75 M US$ (without contingency and selling taxes). The detail of closure cost is shown in Table 18-3.
| May, 2022 |
SRK Consulting Peru SA SEC Technical Report Summary – El Brocal | Page 284 |
Year | Progressive closure | Final Closure | Post Closure | Water treatment | ||||
Direct | Indirect | Direct | Indirect | Direct | Indirect | Direct | Indirect | |
2022 | 11.21 | 1.23 |
|
|
|
|
|
|
2023 | 11.21 | 1.23 |
|
|
|
|
|
|
2024 | 11.21 | 1.23 |
|
|
|
|
|
|
2025 | 11.21 | 1.23 |
|
|
|
|
|
|
2026 | 11.21 | 1.23 |
|
|
|
|
|
|
2027 | 11.21 | 1.23 |
|
|
|
|
|
|
2028 | 11.21 | 1.23 |
|
|
|
|
|
|
2029 | 11.21 | 1.23 |
|
|
|
|
|
|
2030 | 11.21 | 1.23 |
|
|
|
|
|
|
2031 | 11.21 | 1.23 |
|
|
|
|
|
|
2032 | 11.21 | 1.23 |
|
|
|
|
|
|
2033 | 11.21 | 1.23 |
|
|
|
|
|
|
2034 |
|
| 3.81 | 1.74 |
|
| 0.44 |
|
2035 |
|
| 3.81 | 1.74 |
|
| 0.44 |
|
2036 |
|
| 3.81 | 1.74 |
|
| 0.44 |
|
2037 |
|
| 3.81 | 1.74 | 0.03 | 0.01 |
| 6.40 |
2038 |
|
| 3.81 | 1.74 | 0.03 | 0.01 |
| 6.40 |
2039 |
|
|
|
| 0.03 | 0.01 |
| 6.40 |
2040 |
|
|
|
| 0.03 | 0.01 |
| 6.40 |
2041 |
|
|
|
| 0.03 | 0.01 |
| 2.20 |
2042 |
|
|
|
| 0.03 | 0.01 |
| 2.20 |
2043 |
|
|
|
| 0.03 | 0.01 |
| 1.08 |
2044 |
|
|
|
| 0.03 | 0.01 |
| 1.08 |
2045 |
|
|
|
| 0.03 | 0.01 |
| 1.08 |
2046 |
|
|
|
| 0.03 | 0.01 |
| 1.08 |
2047 |
|
|
|
| 0.03 | 0.01 |
| 1.08 |
2048 |
|
|
|
| 0.03 | 0.01 |
| 0.75 |
2049 |
|
|
|
| 0.03 | 0.01 |
| 0.75 |
2050 |
|
|
|
| 0.03 | 0.01 |
| 0.75 |
2051 |
|
|
|
| 0.03 | 0.01 |
| 0.75 |
2052 |
|
|
|
| 0.03 | 0.01 |
| 2.65 |
2053 |
|
|
|
| 0.03 | 0.01 |
| 2.65 |
2054 |
|
|
|
| 0.03 | 0.01 |
| 2.65 |
2055 |
|
|
|
| 0.03 | 0.01 |
| 2.65 |
2056 |
|
|
|
| 0.03 | 0.01 |
| 2.65 |
Total | 134.47 | 14.74 | 19.06 | 8.71 | 0.50 | 0.27 | 1.32 | 51.68 |
Source: Buenaventura
| May, 2022 |
SRK Consulting Peru SA SEC Technical Report Summary – El Brocal | Page 285 |
Basis and Accuracy Level for Cost Estimates |
Basis and Premises for operating cost |
According to the Life of Mine (LOoM) plan, future operations will have conditions similar to those found in current operations but some changes are planned, which have been included in the criteria to estimate operating cost.
The following premises and criteria were considered for the operating cost estimation:
| ● | A 2018-2020 cost database was used for the forecast cost estimation. The cost estimation process began in May 2021, when information on reported 2021’s costs was not available. At the moment, a comparison between the estimated forecast cost and 2021 results was made resulting in a concordance above 90%; |
| ● | Open pit mining in adjacent zones with underground cavities. The block model identifies zones with the potential presence of underground cavities (from older operations) and assigns an over-cost; |
| ● | The progress of open-pit mining is from the northern part of the ore deposit to the southern and moving toward the processing plant located in the southern extreme of the open pit. In this sense, a decrease is expected in the hauling distance and will lead the hauling cost to fall. This aspect was not incorporated in the cost analysis and the hauling cost considered was the same as that applicable under current conditions; |
| ● | An incremental cost was considered for deeper benches. |
| ● | Implementation of cemented backfill plant. The operating cost estimation considers an over-cost for the mining methods, which will use cemented backfill (R&P Pillar recovery, SLS); |
| ● | It is assumed that the cemented backfill plant will be available in November 2024 to begin mining of secondary stopes of SLS; |
| ● | The current mining operation use contractors and cost estimation considers the same schema; |
| ● | Non-inflation rate was considered in the cost estimation; |
| ● | There are no royalties applicable to El Brocal mining operaton; |
| ● | Exploration costs related to brownfield targets are not included in the operating cost estimation. |
Estimated operating costs included:
| ● | Mining cost contractors |
| ● | Mining cycle activities (drilling, blasting, loading, hauling and ground support) |
| ● | Mine development and preparation adits cost |
| ● | Cost of auxiliary services |
| ● | Energy (mining, processing plant and facilities) |
| ● | Processing plant consumables |
| ● | Mine equipment maintenance |
| ● | Processing plant equipment maintenance |
| ● | Supervision and management |
| May, 2022 |
SRK Consulting Peru SA SEC Technical Report Summary – El Brocal | Page 286 |
| ● | Technical services |
| ● | Administrative costs (all areas) |
| ● | Environmental costs |
| ● | Community relations |
| ● | Safety |
Operational parameters considered for cost estimation are listed in Table 18-4.
Table 18-4: Operational parameters
Parameters | Units | Value |
Mine production |
|
|
Open Pit | tpd | 9,500 |
Underground | tpd | 8,500 |
Plant Capacity |
|
|
Plant 1 (Cu) |
|
|
Copper concentrate | tpd | 10,500 |
Plant 2 (PbZn) * |
|
|
Lead Zinc concentrate | tpd | 8,000 |
Copper concentrate | tpd | 9,500 |
Stockpile ** |
|
|
Tonnage | Mt | 0.20 |
Pb | % | 0.54 |
Zn | % | 1.48 |
Ag | oz/t | 1.97 |
Cu | % | 0.37 |
Au | g/t | 0.01 |
Source: Buenaventura | ||
* Plant 2 will be acconditionated to process Copper ores | ||
** Measured at December 31st, 2021 | ||
Basis and Premises for capital cost |
According to references from Buenaventura the estimated capital cost included:
| ● | Mine support facilities and utilities; |
| ● | Backfill plant; |
| ● | Process plant sustaining investments; |
| ● | Tailings storage facilities (growth or elevation increase); |
| ● | Waste dump construction; |
| ● | Site support facilities and utilities; |
| ● | Site power distribution; |
| ● | Camps. |
| May, 2022 |
SRK Consulting Peru SA SEC Technical Report Summary – El Brocal | Page 287 |
Economic Analysis |
General Description |
SRK prepared a cash flow model to evaluate El Brocal’s ore reserves on a real basis. This model was prepared on an annual basis from the effective date of mineral reserve estimation to the effective date project for the exhaustion of mineral reserves. This section presents the main assumptions used in the cash flow model and the resulting indicative economics. The model results are presented in U.S. dollars (US$), unless otherwise stated.
Technical and cost information is presented on a 100% basis to assist the reader in developing a clear view of the fundamentals of the operation. Buenaventura's attributable portion of Mineral Resources and reserves is 61%.
As with the capital and operating cost forecasts, the economic analysis is inherently a forward-looking exercise. These estimates rely upon a range of assumptions and forecasts that are subject to change depending upon macroeconomic conditions, operating strategy and new data collected through future operations.
According rules S-K 1300, all inputs to the economic analysis are at the minimum of a pre-feasibility level of confidence and have an accuracy level of ±25% and a contingency range below 15%.
Mineral Resources The financial analysis is based on an after-tax discount rate of 7.77%. All costs and prices are in unescalated “real” dollars expressed as Real US$ 2021. The currency used to document the cash flow is US$.
Financial Model Parameters |
Key criteria used in the analysis are presented throughout this section. Financial model parameters are summarized in Table 19-1.
Table 19-1: Financial Model Parameters
Item | Value |
TEM Time Zero Start Date | January 1st, 2022 |
Mine Life | 11 |
Discount Rate | 7.77% |
Source: Buenaventura, SRK |
The model continues after the 11th year to includes the whole closure cost in the cash flow analysis.
Buenaventura set a discount rate of 7.77%.
External Factors |
Exchange Rates
El Brocal’s operations are located in the central Andes of Peru. The official currency in Peru is the “Peruvian Sol”. However, in accordance with typical practices in the Peruvian mining industry, most of the payments for services, consumables and others are made directly in US dollars (US$). Only a minor portion of payments is made in local currency (for example, salaries or some independent services).
An official exchange rate is announced daily by the Peruvian Central Bank. The exchange rate in the last ten years has shown remarkable stability.
| May, 2022 |
SRK Consulting Peru SA SEC Technical Report Summary – El Brocal | Page 288 |
The operating and capital costs are modeled directly in US Dollar (US$)
Metal Prices
Modeled prices are based on the prices developed by CRU Group in the Market Study section of this report. CRU Group developed two metal prices set options, “Nominal USD” and “Real 2021 US$”.
The financial model is based on Real 2021 US$ set price.
Table 19-2: Metal Prices forecast
Metal | Units | Projected Metal Prices | |||||
2022 | 2023 | 2024 | 2025 | 2026 | 2027 | ||
Cu | US$/t | 9,010 | 8,201 | 7,752 | 8,104 | 8,448 | 8,244 |
Zn | US$/t | 3,490 | 3,095 | 2,604 | 1,975 | 2,131 | 2,197 |
Pb | US$/t | 2,227 | 2,152 | 2,155 | 2,163 | 2,170 | 2,152 |
Au | US$/oz | 1,740 | 1,660 | 1,580 | 1,630 | 1,715 | 1,677 |
Ag | US$/oz | 22.90 | 23.40 | 24.20 | 25.90 | 28.20 | 27.30 |
Metal | Units | Projected Metal Prices | |||||
2028 | 2029 | 2030 | 2031 | 2032 | 2033 | ||
Cu | US$/t | 8,041 | 7,838 | 7,634 | 7,431 | 7,450 | 7,469 |
Zn | US$/t | 2,264 | 2,330 | 2,397 | 2,463 | 2,469 | 2,475 |
Pb | US$/t | 2,135 | 2,117 | 2,099 | 2,081 | 2,086 | 2,091 |
Au | US$/oz | 1,639 | 1,603 | 1,567 | 1,532 | 1,498 | 1,465 |
Ag | US$/oz | 26.50 | 25.60 | 24.80 | 24.10 | 23.30 | 22.60 |
Source: CRU Group, February 23th, 2022 | |||||||
* Expressed as Real 2021 US$ | |||||||
Taxes and Royalties
As modeled, the operation is subject to a 29.50% income tax plus a special mining income tax (variable rate).
Tax depreciation depends on the investment type and is calculated annually on a percentage basis; this figure is used to estimate the income tax payable. Typical depreciation periods used are 5 years, 10 years and LoM.
There are no third party royalties applicable to El Brocal’s operations
SRK notes that the mining units are being evaluated with a corporate structure cost, including the cost of corporate offices located in Lima.Office costs in Lima are distributed between all managed mining units.
Mining concession holders are obligated to pay a Special Mining Tax (IEM) to exploit metallic Mineral Resources. For income tax purposes, the IEM is considered an expense in the same year it is paid. IEM is determined on a quarterly basis and a percentage is applied to the quarterly operating profit.
Participation of workers in a profit-sharing scheme is a labor benefit that seeks to boost employee productivity. This charge is set at 8% of the operation’s profit before taxes.
| May, 2022 |
SRK Consulting Peru SA SEC Technical Report Summary – El Brocal | Page 289 |
Mineral Resources.
Working Capital
The assumptions used for working capital in this analysis are as follows:
| ● | Accounts Receivable (A/R): 30 day delay |
| ● | Accounts Payable (A/P): 30 day delay |
| ● | Zero opening balance for A/R and A/P |
Technical Factors |
Mining Profile
The modeled mining profile was developed by Buenaventura in collaboration with SRK. The details of mining profile are outlined earlier in this report. The modeled profile is presented on a 100% basis in Figure 19-1..
Figure 19-1: El Brocal Mining profile graphic
Souce: SRK, Buenaventura
A summary of the modeled life of mine mining profile is presented in Table 19-3.
Table 19-3: El Brocal Mining Summary
LOM Mining | Units | Value |
Total OP Ore Mined | Mt | 34.79 |
Total UG Ore Mined | Mt | 32.48 |
Total Waste Mined | Mt | 377.94 |
Total Material Mined | Mt | 445.22 |
LoM Strip Ratio | Adim | 10.86 |
Source: SRK |
| May, 2022 |
SRK Consulting Peru SA SEC Technical Report Summary – El Brocal | Page 290 |
Processing Profile
The processing profile was developed by Buenaventura in collaboration with SRK. No blending stockpile was considered in the analysis. The modeled profile is presented on a 100% basis in Figure 19-2.

Figure 19-2: El Brocal Processing profile graphic
Source: SRK, Buenaventura
Yearly Estimated Costs
Main yearly costs were estimated outside of the Cash Flow template and incorporated to the Cash Flow template as a fixed cost on an annual basis.
Results for the mining cost, processing cost, and administrative cost estimation on an annual basis are shown in Table-19-4, Table 19-4, Table 19-5, Table 19-6 and Table 19-7.
Table 19-4: Reference unit cost for Yearly cost calculation
Rock / Material | Plant * | Reference Unit Cost ** | ||
Mining | Proccesing | G&A | ||
OP Waste |
| 1.70 |
|
|
OP Ore | PbZn | 2.11 | 15.88 | 6.22 |
OP Ore | Cu | 2.11 | 14.80 | 6.22 |
R&P Primary | Cu | 25.34 | 14.80 | 6.22 |
R&P Remanent | Cu | 26.50 | 14.80 | 6.22 |
R&P Pillar Recov | Cu | 26.66 | 14.80 | 6.22 |
SLS | Cu | 28.64 | 14.80 | 6.22 |
Source: SRK, Buenaventura
| May, 2022 |
SRK Consulting Peru SA SEC Technical Report Summary – El Brocal | Page 291 |
Table 19-5: Yearly material movement (tonnage)
Rock / Material | Plant * | Production Year (Tonnage) | ||||||||||
2022 | 2023 | 2024 | 2025 | 2026 | 2027 | 2028 | 2029 | 2030 | 2031 | 2032 | ||
OP Waste |
| 26.8 | 35.5 | 50.0 | 49.9 | 43.7 | 43.6 | 42.5 | 37.1 | 33.1 | 14.4 | 1.1 |
OP Ore | PbZn | 2.1 | 2.9 | 2.0 | 0.8 | 0.0 | 0.0 | 0.0 | 0.0 | 0.0 | 0.5 | 0.2 |
OP Ore | Cu | 0.5 | 0.5 | 1.3 | 2.2 | 3.3 | 3.3 | 3.3 | 3.3 | 3.3 | 2.9 | 2.2 |
R&P Primary | Cu | 1.7 | 1.8 | 1.9 | 1.8 | 0.4 | 0.5 | 0.9 | 0.9 | 0.5 | 1.5 | 1.9 |
R&P Remanent | Cu | 0.1 | 0.1 | 0.2 | 0.1 | 0.0 | 0.0 | 0.0 | 0.0 | 0.1 | 0.1 | 0.0 |
R&P Pillar Recov | Cu | 0.3 | 0.4 | 0.2 | 0.0 | 0.0 | 0.0 | 0.0 | 0.0 | 0.0 | 0.0 | 0.0 |
SLS | Cu | 0.9 | 0.7 | 0.7 | 1.3 | 2.4 | 2.3 | 1.9 | 1.8 | 2.2 | 1.2 | 1.5 |
Source: SRK, Buenaventura
Table 19-6: Yearly incremental (Bench) cost - Ore & Waste
Rock / Material | Units | Production Year (Yearly Cost) | ||||||||||
2022 | 2023 | 2024 | 2025 | 2026 | 2027 | 2028 | 2029 | 2030 | 2031 | 2032 | ||
Incremental Cost *** | MUS$ | 2.28 | 2.44 | 2.76 | 2.70 | 3.53 | 4.39 | 1.69 | 1.27 | 3.56 | 2.77 | 0.51 |
Source: Buenaventura, SRK | ||||||||||||
* Destination of material | ||||||||||||
** Reference unit cost expressed as US$/t. It does not include a contingency percentage | ||||||||||||
*** Incremental bench cost expressed as MUS$/year. It was calculated in detail | ||||||||||||
Table 19-7: Yearly Cost (No contingency)
Rock / Material | Units | Production Year (Yearly Cost) | ||||||||||
2022 | 2023 | 2024 | 2025 | 2026 | 2027 | 2028 | 2029 | 2030 | 2031 | 2032 | ||
Mining Cost | MUS$ | 131.18 | 149.40 | 175.19 | 180.02 | 163.69 | 164.13 | 158.52 | 148.49 | 145.20 | 109.40 | 99.57 |
Processing Cost | MUS$ | 83.77 | 97.98 | 96.18 | 92.82 | 90.93 | 90.93 | 91.05 | 90.93 | 90.93 | 92.08 | 87.14 |
G&A Cost | MUS$ | 34.25 | 39.87 | 39.51 | 38.67 | 38.22 | 38.22 | 38.27 | 38.22 | 38.22 | 38.49 | 36.53 |
Source: Buenaventura, SRK |
* Destination of material |
** Reference unit cost expressed as US$/t. It does not include a contingency percentage |
*** Incremental bench cost expressed as MUS$/year. It was calculated in detail |
Table 19-8: Yearly cost (Including contingency 10%)
Rock / Material | Units | Production Year (Yearly Cost) | ||||||||||
2022 | 2023 | 2024 | 2025 | 2026 | 2027 | 2028 | 2029 | 2030 | 2031 | 2032 | ||
Mining Cost (Cont) | MUS$ | 144.30 | 164.34 | 192.70 | 198.02 | 180.06 | 180.54 | 174.38 | 163.34 | 159.72 | 120.34 | 109.53 |
Processing Cost (Cont) | MUS$ | 92.14 | 107.77 | 105.80 | 102.10 | 100.02 | 100.02 | 100.15 | 100.02 | 100.02 | 101.29 | 95.85 |
G&A Cost (Cont) | MUS$ | 37.68 | 43.85 | 43.46 | 42.53 | 42.04 | 42.04 | 42.09 | 42.04 | 42.04 | 42.34 | 40.18 |
Source: Buenaventura, SRK | ||||||||||||
* Destination of material | ||||||||||||
** Reference unit cost expressed as US$/t. It does not include a contingency percentage | ||||||||||||
*** Incremental bench cost expressed as MUS$/year. It was calculated in detail | ||||||||||||
| May, 2022 |
SRK Consulting Peru SA SEC Technical Report Summary – El Brocal | Page 292 |
Corporate costs
Corporate cost, including the cost of administrative office in Lima, was estimated by Buenaventura on a yearly basis. No further detail is available.
A summary of corporate costs is shown in Table 19-9.
Table 19-9: Summary of Corporate Costs
Item | Units | Production Year | ||||||||||
2022 | 2023 | 2024 | 2025 | 2026 | 2027 | 2028 | 2029 | 2030 | 2031 | 2032 | ||
G&A Corporate | MUS$ | 8.6 | 9.5 | 10.4 | 9.2 | 8.2 | 8.3 | 7.9 | 7.8 | 6.6 | 6.8 | 6.4 |
Source: Buenaventura
Capital Cost
Capital cost was estimated by Buenaventura in a yearly basis. No further detail is available.
A summary of capital costs is shown in Table 19-10.
Table 19-10: Yearly capital costs
Item | Units | Production Year | ||||||||||
2022 | 2023 | 2024 | 2025 | 2026 | 2027 | 2028 | 2029 | 2030 | 2031 | 2032 | ||
Capital Cost LoM | MUS$ | 46.7 | 40.0 | 56.9 | 43.5 | 24.8 | 10.5 | 16.1 | 21.4 | 12.0 | 10.0 | 7.1 |
Source: Buenaventura, SRK | ||||||||||||
19.2 | Results |
The economic analysis metrics are prepared on an annual after-tax basis in US$. The results of the analysis are presented in Table 19-12. Note that because the mine is operating and valued on a total project basis by treating prior costs as sunk, IRR and payback period analysis are not relevant metrics.
Indicative economic results are shown in the Table 19-11
Table 19-11: Indicative Economic Results
Units | Value | |
LoM Cash Flow (Unfinanced) |
|
|
Total Net Sales | M US$ | 4,569.74 |
Total Operating cost | M US$ | 3,352.76 |
Total Operating Income | M US$ | 293.17 |
Income Taxes Paid | M US$ | 32.16 |
EBITDA |
|
|
Free Cash Flow | M US$ | 991.76 |
NPV @ 7.77% | M US$ | 707.72 |
After Tax |
|
|
Free Cash Flow | M US$ | 320.18 |
NPV @ 7.77% | M US$ | 277.03 |
Source: SRK
| May, 2022 |
SRK Consulting Peru SA SEC Technical Report Summary – El Brocal | Page 293 |
Table 19-12: Cashflow Analysis on an Annualized Basis
Operational Indicators | 2022 | 2023 | 2024 | 2025 | 2026 | 2027 | 2028 |
Ore Treated | 5,506,855 | 6,409,351 | 6,352,289 | 6,216,275 | 6,144,000 | 6,144,000 | 6,152,000 |
Cu Head Grade (%) | 1.64 | 1.49 | 1.29 | 1.37 | 1.26 | 1.23 | 1.23 |
Pb Head Grade (%) | 0.96 | 1.00 | 1.52 | 0.95 | - | - | - |
Zn Head Grade (%) | 1.65 | 1.79 | 2.81 | 3.02 | - | - | - |
Au Head Grade (g/tm) | 0.46 | 0.71 | 0.59 | 0.68 | 0.57 | 0.81 | 0.89 |
Ag Head Grade (oz/tm) | 1.33 | 1.56 | 1.25 | 0.80 | 0.26 | 0.37 | 0.40 |
Cu Fines (mt) | 46,717 | 48,308 | 61,060 | 63,271 | 67,407 | 68,192 | 69,308 |
Pb Fines (mt) | 7,143 | 13,798 | 15,369 | 3,358 | 0 | 0 | 0 |
Zn Fines (mt) | 17,782 | 27,476 | 31,663 | 12,992 | 0 | 0 | 0 |
Au Fines (oz) | 13,368 | 24,237 | 19,751 | 25,353 | 22,436 | 27,543 | 38,612 |
Ag Fines (oz) | 5,305,639 | 6,787,680 | 7,237,136 | 4,894,940 | 1,619,968 | 1,827,863 | 1,260,084 |
Operating Cost (US$/tm) | 49.8 | 49.3 | 53.8 | 55.1 | 52.4 | 52.5 | 51.5 |
Mine Cost (US$/tm) | 26.2 | 25.6 | 30.3 | 31.9 | 29.3 | 29.4 | 28.3 |
Plant Cost (US$/tm) | 16.7 | 16.8 | 16.7 | 16.4 | 16.3 | 16.3 | 16.3 |
Services Cost (US$/tm) | 6.8 | 6.8 | 6.8 | 6.8 | 6.8 | 6.8 | 6.8 |
D&A (US$/tm) | 8.5 | 9.0 | 10.5 | 12.9 | 14.6 | 14.0 | 12.7 |
P&L | |||||||
Net Sales | |||||||
- Mine | 434,760 | 480,917 | 526,147 | 466,240 | 419,818 | 423,977 | 406,354 |
- Plant | (144,296) | (164,342) | (192,704) | (198,020) | (180,062) | (180,541) | (174,375) |
- Services | (92,144) | (107,773) | (105,795) | (102,103) | (100,024) | (100,024) | (100,155) |
Operating Cost | (37,678) | (43,853) | (43,462) | (42,532) | (42,037) | (42,037) | (42,092) |
D&A | (274,118) | (315,968) | (341,961) | (342,655) | (322,124) | (322,602) | (316,622) |
Gross Income | (46,868) | (57,600) | (66,800) | (79,887) | (89,892) | (86,299) | (77,982) |
Selling Expenses | 113,774 | 107,350 | 117,386 | 43,699 | 7,803 | 15,076 | 11,750 |
G&A | (7,160) | (8,076) | (8,611) | (7,319) | (7,547) | (7,538) | (7,660) |
Operating Income | (8,611) | (9,548) | (10,376) | (9,169) | (8,184) | (8,266) | (7,922) |
Royalties | 98,003 | 89,726 | 98,398 | 27,211 | -7,928 | -729 | -3,832 |
FCF | (6,701) | (6,841) | (7,490) | (5,207) | (4,198) | (4,240) | (4,064) |
EBITDA | |||||||
Workers Participation | |||||||
Income Tax | 138,169 | 140,485 | 157,708 | 101,891 | 77,765 | 81,330 | 70,086 |
CAPEX | (7,304) | (6,631) | (7,273) | (1,760) | - | - | - |
Mine Closure | (10,281) | (9,138) | (10,227) | (2,514) | - | - | - |
Free Cash Flow | (53,659) | (46,000) | (65,435) | (50,025) | (28,520) | (12,075) | (18,515) |
Operational Indicators | 2029 | 2030 | 2031 | 2032 | 2033 | 2034 | 2035 |
Ore Treated | 6,144,000 | 6,144,000 | 6,187,890 | 5,872,794 | - | - | - |
Cu Head Grade (%) | 1.14 | 1.31 | 1.33 | 1.20 | - | - | - |
Pb Head Grade (%) | - | - | 0.76 | 0.34 | - | - | - |
Zn Head Grade (%) | - | - | 1.98 | 2.43 | - | - | - |
Au Head Grade (g/tm) | 1.14 | 0.86 | 1.02 | 0.79 | - | - | - |
Ag Head Grade (oz/tm) | 0.52 | 0.39 | 0.66 | 0.57 | - | - | - |
Cu Fines (mt) | 67,539 | 61,012 | 61,647 | 59,236 | - | - | - |
Pb Fines (mt) | 0 | 0 | 1,352 | 267 | - | - | - |
Zn Fines (mt) | 0 | 0 | 4,898 | 2,793 | - | - | - |
Au Fines (oz) | 46,881 | 35,154 | 39,022 | 34,944 | - | - | - |
Ag Fines (oz) | 1,587,702 | 1,274,464 | 2,736,414 | 2,309,550 | - | - | - |
Operating Cost (US$/tm) | 49.7 | 49.1 | 42.7 | 41.8 | - | - | - |
Mine Cost (US$/tm) | 26.6 | 26.0 | 19.5 | 18.7 | - | - | - |
Plant Cost (US$/tm) | 16.3 | 16.3 | 16.4 | 16.3 | - | - | - |
Services Cost (US$/tm) | 6.8 | 6.8 | 6.8 | 6.8 | - | - | - |
D&A (US$/tm) | 11.8 | 10.5 | 9.2 | 9.0 | - | - | - |
P&L | |||||||
Net Sales | 398,141 | 336,739 | 346,607 | 330,044 | - | - | - |
- Mine | (163,340) | (159,719) | (120,338) | (109,526) | - | - | - |
- Plant | (100,024) | (100,024) | (101,286) | (95,854) | - | - | - |
- Services | (42,037) | (42,037) | (42,338) | (40,182) | - | - | - |
Operating Cost | (305,402) | (301,781) | (263,962) | (245,561) | - | - | - |
D&A | (72,485) | (64,320) | (57,075) | (52,945) | - | - | - |
Gross Income | 20,254 | -29,362 | 25,570 | 31,537 | - | - | - |
Selling Expenses | (7,461) | (7,019) | (7,085) | (6,593) | - | - | - |
G&A | (7,762) | (6,565) | (6,757) | (6,434) | - | - | - |
Operating Income | 5,032 | -42,946 | 11,728 | 18,510 | - | - | - |
Royalties | (4,082) | (3,367) | (3,701) | (3,671) | - | - | - |
FCF | |||||||
EBITDA | 73,435 | 18,007 | 65,102 | 67,785 | - | - | - |
Workers Participation | (76) | - | (642) | (1,187) | - | - | - |
Income Tax | - | - | - | - | - | - | - |
CAPEX | (24,610) | (13,800) | (11,500) | (8,165) | - | - | - |
Mine Closure | (14,299) | (14,299) | (14,299) | (14,299) | (14,299) | (8,134) | (8,134) |
Free Cash Flow | 34,450 | -10,092 | 38,661 | 44,134 | (14,299) | (8,134) | (8,134) |
Source: Buenaventura
| April, 2022 |
SRK Consulting Peru SA SEC Technical Report Summary – El Brocal | Page 294 |
Sensitivity Analysis |
SRK performed a sensitivity analysis to determine the relative sensitivity of the operation’s NPV to a number of key parameters. This is accomplished by flexing each parameter upwards and downwards by 10%. Within the constraints of this analysis, the operation appears to be most sensitive to: commodity prices, metallurgical recovery and mining costs assumptions.
SRK cautions that this sensitivity analysis is for informational purposes only and notes that these parameters were flexed in isolation within the model and are assumed to be uncorrelated; this may not be an accurate reflection of reality. Additionally, the amount of flex in the selected parameters may violate physical or environmental constraint that are present at the operation.
Figure 19-3: El Brocal NPV Sensitivity Analysis
Source: SRK, Buenaventura
| April, 2022 |
SRK Consulting Peru SA SEC Technical Report Summary – El Brocal | Page 295 |
Adjacent Properties |
Colquijirca belongs to the XVII metallogenic belt corresponding to epithermal Au-Ag deposits and polymetallic deposits (INGEMMET, 2021). Located in the Cerro de Pasco region, it has a long productive mining history dating back to pre-Inca times.
One of the main mining units near Colquijirca is Cerro de Pasco unit.
Cerro de Pasco operating unit is located in the Pasco region, approximately 295 km from Lima and with access through the Carretera Central highway. This unit consists of three mines: two underground (Paragsha, Vinchos) and one open pit (Raul Rojas). During 2019, stockpile ore treatment at the Paragsha-San Expedito plant amounted to 2.1 million tonnes, with grades of 1.89% Zn, 0.63% Pb, and 0.82 oz Ag/MT. This ore corresponds to the clearing of Raul Rojas pit. In 2019, fines production amounted to 17.5 thousand tonnes of zinc, 6.3 thousand tonnes of lead, and 0.79 million ounces of silver compared to the results obtained in 2018 with 11.2 thousand tonnes of zinc, 3.7 thousand tonnes of lead, and 0.4 million ounces of silver due to higher ore treatment and better head grades.
| April, 2022 |
SRK Consulting Peru SA SEC Technical Report Summary – El Brocal | Page 296 |
| April, 2022 |
SRK Consulting Peru SA SEC Technical Report Summary – El Brocal | Page 297 |
Interpretation and Conclusions |
Geology & Exploration |
The mineral deposits of the Colquijirca district belong to a member of the family of porphyry copper (Cu) related deposits known as Cordilleran deposits. These types of deposits, which are generally formed in the upper parts of a porphyry Cu, are fundamentally characterized by prominent zoning with internal parts that are dominated by Cu and external zones where Zn, Pb and Ag are the main economically interesting elements. In the case of the Colquijirca district, and specifically the area between the Marcapunta Norte and Colquijirca sectors, such zoning generally consists of three zones, which mineralogically consist mainly of enargite in the internal parts; chalcopyrite in the intermediate parts; and sphalerite and galena in the external parts (El Brocal, 2021).
According to Bendezú, Fontboté, & Cosca (2003), in the Colquijirca district, the relative sequence of events and the absolute ages obtained establish that Cordilleran base metal lode and replacements ores, which are mainly epithermal and formed at high-sulfidation and oxidations states, were emplaced considerably later (~460,000 years) than the Au–(Ag) high-sulfidation epithermal mineralization
Many classic districts known for their epithermal porphyry copper and/or Au- (Ag) deposits may host concentrations of "Cordilleran base metal veins" at any spatial position upward from the porphyry environment. These may occur at levels as shallow as the epithermal environment, which in carbonate rocks may be characterized by fine-grained Zn-Pb mineralization.
SRK notes that the property is not at an early stage of exploration, and that results and interpretation if exploration data is generally supported in more detail by extensive drilling and active mining exposure of the orebody in pits and underground works.
QA/QC & Data verification |
SRK has conducted a comprehensive review of the available QA/QC data as part of the sample preparation, analysis, and security review. SRK believes that the QA/QC protocols are currently consistent with accepted industry best practices.
The insertion of control samples to validate contamination, precision and accuracy of the database has been performed regularly since 2007. SRK observed that the rate of standards control samples in drill holes is less than the rate indicated in Buenaventura's protocol.
In SRK's opinion, sample preparation, chemical analysis, quality control, and security procedures at El Brocal have historically shown that there may be issues with accuracy and precision of results to support the estimation of measured Mineral Resources and proven reserves, especially for areas characterized by analyses at the El Brocal Internal Laboratory. Therefore, SRK has considered the QAQC analysis results as a risk in the classification of Mineral Resources and reduced overall classification accordingly as discussed in Section 11.5.10 of this report.
SRK has noted that the database contains historical information with no laboratory certificates, which means that cross validation could not be performed on this information. In SRK's opinion, the remaining information that could be validated is consistent and acceptable for Mineral Resource Estimation.
SRK has observed that the database has a number of minor findings or inconsistencies, the vast majority of which correspond to historical information obtained from data migration. Although a complete reconciliation of the certificate information to the digital database could not be completed,
| April, 2022 |
SRK Consulting Peru SA SEC Technical Report Summary – El Brocal | Page 298 |
SRK notes that most of the current resource is supported by contemporary information that could be compared to information on the original certificate. The incidence of error for the data that could be compared was limited and deemed immaterial to the disclosure of Mineral Resources.
Mineral processing |
El Brocal’s mineral processing facilities include two independent conventional flotation plants. Plant 1 processes copper ore while Plant 2 processes lead and zinc ores. Plant 1 receives ore from Marcapunta mine, and Plant 2 receives fresh ore from Tajo Norte mine and low silver content ore from Marcapunta. Plant 2 can process copper ores by campaigns, currently a campaign of 30 days by year is implemented in the Plant 2 for treatment of Copper ore.
Data available to SRK covered the period form 2017 until 2020. Figures for 2020 show a number of anomalies and erratic behavior, which are attributable to the negative impacts on the industry from unforeseen external factors. The figures from 2020 figures are, in general, excluded or considered unrepresentative of normal operations for the purposes of this document.
El Brocal’s Marcapunta underground mine’s ore production for the period in question shows monthly values ranging from 2.5 to 2.8 million t per year averaging approximately 1.88% Cu with a minimum of 1.63% Cu and 2.32% Cu maximum. Arsenic averaged 0.61%, with a minimum of 0.53% and a maximum of 0.75%. Gold averaged 0.54 g/ton with low of 0.40 g/ton and high of 0.80 g/t. Copper and iron head grades suggest a slight upward trend that began in 2018; nevertheless, 2020’s anomalies may be biasing this observation and need to be confirmed with data from future years. Ninety-three percent (93%) of Marcapunta’s total production of ore tonness was classified
as copper-silver rich ore and delivered to Plant 1; the balance of approximately 7% fed Plant 2. Overall, Marcapunta represented only 6% of Plant 2’s total throughput.
SRK is of the opinion that processing facilities like Plant 1 should operate in the 90% to 95% range, or even higher. SRK also believes it is in El Brocal’s best interest to identify bottlenecks in the ore supply end and within Plant 1 itself that are preventing improvements in operating time. Removing bottlenecks will lower unit costs; improve overall stability; and allow better control the key operating parameters in the plant.
Plant 1Plant 1SRK requested but was denied historical information regarding arsenic’s impact on the concentrate valuation; therefore, SRK was unable to offer a supported opinion about the quality of copper concentrates or the suitability of operating practices, including mine planning and processing as well as the ship ability and saleability of the production.
SRK requested but was denied information related to concentrate sales, including actual invoices. SRK is unable to confirm that the declared production was actually sold and that the economic terms used in the planning and estimates are realistic and reliable. Similarly, the reconciliation analysis between mine and mill could not be verified.
Mineral Resource estimates |
SRK verified the block model estimations through of different techniques included cross validation, visual inspection of the composites and the block grades, statistical comparison among composites and block model distributions, and also statistical comparison among estimations obtained with the nearest neighbor method, through swath plots.
SRK has revised some aspects that can be considered as uncertainties in El Brocal Mineral Resource estimation, which are: The density assigned in the block model has enough support for
| April, 2022 |
SRK Consulting Peru SA SEC Technical Report Summary – El Brocal | Page 299 |
most of the estimation domains, however, there are some domains that have low data density. Buenaventura must conduct an additional sampling program in the next drilling program.
El Brocal must improve the geological interpretation to increase the confidence on the geological models, which must be supported with the geological mapping of alterations, mineralization and lithology. El Brocal structural model is a key and important point towards the southern part in the underground zone.
The estimation domains for all the elements must be revised in detail to improve their definition. There are zones where the model can be improved, especially in those zones in which the grade interpolation is underestimated locally.
The resource classification that reflects resource estimation confidence constitutes a key and sensitive aspect of the assessment of El Brocal Mine. Although the mine has been producing since 2011 and has an extensive drilling program, its level of measured resources is limited due to several factors, such as the absence of a powerful structural model in the southern zone and low QA/QC performance in some areas of El Brocal.
Mining methods |
El Brocal’s open pit operations has as a production target 9,500 tpd of ore. Based on this, the LOM has been estimated at 10 years (2022 to 2032) exploiting 26.22 Mt Cu ore (1.67% Cu, 0.71 oz/t Ag y 0.22 g/t Au) and 8.69 Mt Pb/Zn ore (1.06% Pb, 2.13% Zn y 2.85 oz/t Ag
El Brocal’s underground operations has as a production target 8,500 tpd of ore. Based on this, the LOM has been estimated at 11 years (2022 to 2033) exploiting 35.74 Mt Cu ore (1.27% Cu, 0.70 oz/t Ag y 0.74 g/t Au)
Recovery methods |
El Brocal operates two independent conventional flotation plants, namely Plant 1 and Plant 2. Plant 1 processes copper ore from Marcapunta mine to recover copper minerals to produce copper concentrate. Plant 2 processes lead and zinc ores, primarily from the Tajo Norte mine, to recover lead and zinc minerals to produce lead concentrate and zinc concentrate
Plant 1 is a conventional concentration plant and produces copper concentrate. This material transported offsite by dump trucks, and to a lesser extent, by rail cars, for sale to third parties. The plant’s unit processes include crushing, grinding, flotation, and thickening. Final tails are thickened and disposed of in a conventional tailing’s storage facility. Final concentrate generated in the flotation stage is thickened, then dewatered before being sent to Callao Port.
In SRK’s experience, a large variability in fresh feed (ore throughput) typically has a negative impact on plant’s performance, which is included but not limited to the following:
| ● | Poor grinding efficiency and consequently, an increase in steel consumption for steel balls, ball mill liners as well as accelerated wearing in the classification systems, including slurry pumps. |
| ● | Instability in the flotation feed stream, which leads to low-quality concentrate and undesirable deportment of metals because cross-contamination of minerals. |
| ● | Incurring in unnecessary operating expenditures in the way maintenance labor and spare parts. |
| ● | Additionally, low grade concentrate translates into commercial terms that fall below the industry benchmark and imply unnecessary handling costs when using trucks and/or ocean shipping |
| April, 2022 |
SRK Consulting Peru SA SEC Technical Report Summary – El Brocal | Page 300 |
SRK requested but was denied of the necessary detailed information to properly support the metallurgical parameters required to estimate Reserves & Resources. It is SRK’s opinion that the high content of deleterious elements may translate into a material loss of value for El Brocal’s concentrate. As such, the current estimates of the blocks’ value may not accurately represent future economics.
Plant 2 is a conventional, sequential multi-stage concentrator that produces lead and zinc concentrates that are trucked offsite to be sold to third parties. The plant’s unit processes include crushing, washing, grinding, and flotation. Final tails are thickened and disposed of in a conventional tailing’s storage facility. Final concentrates are thickened and dewatered before being trucked off site.
Mined ore is re-handled multiple times before being delivered to the mill. In SRK’s opinion, there are no technical reasons to support rehandling. Apparently, this takes reflects a social commitment with surrounding communities. Additional and unnecessary expenditure is a clear outcome from this practice.
During the visit to El Brocal facilities, SRK observed a highly unusual and unnecessary number of operators for a maintenance job on a small rod mill. The explanation given to SRK was that the number of operators was directly associated with contractual obligations with the union.
Both Plant 1 and Plant 2 show a high degree of variability in their key performance indicators, which includes tonnes per day (and tonnes per hour) of fresh feed and grinding P80. An unstable mill feed is usually a driver of low recovery and poor-quality concentrates. The mill´s mechanical availability appears to be driven by regular malfunctioning or upsets mostly from ancillary systems like conveyor and chutes, and not from major process equipment problems.
Process automation, although present, is not operating to the standards required. An online metal assaying system for flotation was not working at the time of the visit, and apparently haven’t operated for a long time. Typically, unless the operating workforce is well experienced and has a positive attitude towards continuous improvement, the only tool to maintain and improve metallurgical performance entails measuring key variables.
In SRK’s opinion, the absence of a system to integrate geological, mining, metallurgical, and commercial data in a suitable geometallurgical model is negatively impacting El Brocal’s bottom line. The processing plant will perform at its maximum when fresh feed is within expected parameters for lithology, mineralogy, alteration and grades. At this in time, El Brocal seems to consider only parameters for grade. Additional mechanical issues at the plant are also taking a toll.
SRK is also of the opinion that given El Brocal’s potentially long mine life, efforts to modernize the flowsheet, particularly for the crushing-grinding stages, should be assessed. Currently, the use of small capacity rod mills followed by ball mills is clearly demanding large operating and maintenance crews and driving low mechanical availability, which jacks up operating expenditures.
Infrastructure |
Rock Waste Management Facility design was developed in 2008 by DCR Ingenieros. It considered an extension of 205 Ha for a storage volume of 135.7 Mm³ or 240 Mt and an estimated density of 1.8 t/m³ of dumped waste rock. This storage capacity would cover the life of mine forecasts, which for that year contemplated a production of 110 Mt of waste rock over a period of 10 years.
The Huachuacaja tailings management facility has been designed to be heightened in eight stages, which correspond to: Stage 1 (4157.5 MASL), Stage 2 (4161.5 MASL), Stage 3 (4167.5 MASL),
| April, 2022 |
SRK Consulting Peru SA SEC Technical Report Summary – El Brocal | Page 301 |
Stage 4 (4173.5 MASL), Stage 5 (4178.5 MASL), Stage 6 (4184.5 MASL), Stage 7 (4193.5 MASL), and Stage 8 (4197.5 MASL). Heightening is currently up to Stage 3, having stored 42 Mt of tailings and it is estimated that it can store an accumulated volume of 86 Mt up to Stage 4; 116 Mt up to Stage 5; 164 Mt up to Stage 6; 242 Mt up to Stage 7; and 266 Mt up to Stage 8 and considers the formation of a tailings beach of 0. 5%; a freeboard of 5 m; an operational pond volume of 1.0 Mm³; and a probable maximum flood (PMF) volume of 3.8 Mm³, corresponding to a probable maximum of 24-hour rainfall of 229 mm. The average dry density of the deposited tailings will be 1.59 t/m³.
Market studies |
Given that El Brocal’s copper concentrate has levels of arsenic that make it difficult for smelters to process and for traders to position in the market, high penalties are levied, which are reflected in Buenaventura’s past contracts. However, even with its difficulties, the concentrate is ultimately sold to players in the industry who have experience handling it. Going forward, Buenaventura has contracts in place that secure sales for 100%, 75% and 15% of the copper concentrate production coming from El Brocal in 2022, 2023 and 2024 respectively. Buenaventura has long-standing relationships with these buyers, and it is likely that conversations with them will be ongoing in order to continue positioning this concentrate in the market.
Buenaventura’s zinc concentrate from El Brocal has a relatively standard zinc content and high silver content. This is one of the least complex products in Buenaventura’s portfolio and is generally regarded as a versatile product that has no problem finding a market. Although the high humidity of the concentrate is the only small element of concern, this does not have an impact on payability. Going forward, Buenaventura has contracts in place with standard buyers committing 82% of El Brocal’s zinc concentrate production in 2022, and 21% in 2023. The business relationship with these buyers is ongoing and negotiations are expected to continue to take place in the future.
El Brocal’s lead concentrate has a relatively low lead content, with silver content on the higher side. With arsenic content at ~0.4% and taking into consideration the deposit’s overall arsenic levels, arsenic content could lead to the concentrate being blended during certain periods of time. However, this should not present an issue for traders and buyers with experience in this area and, overall, El Brocal’s lead concentrate is seen as a good quality concentrate that does not present challenges when blending. Going forward, Buenaventura has contracts in place securing sales for 48% of El Brocal’s lead concentrate production in 2022 and 11% of expected production for 2023. The business relationship with these buyers is ongoing and it is likely that negotiations will continue to take place in the future.
Environmental studies & Permitting |
SRK has confirmed that the Colquijirca Unit’s PAMA was approved by the regulatory authority in 2002. Subsequently, that mine received approval for several EIAs for different components and expansions of the operation (2001, 2004, 2008, 2011, 2014, amendments to these studies
(2012); and complied with minor or environmentally non-significant variations of the STR (2016, 2017, 2018, 2019, and 2021) as well as with elements of prior communications.
Additionally, SRK has observed that the unit took advantage of all the opportunities provided by the regulation to regularize some components or activities that at the time may not have been covered by the environmental studies. This was the case with the approval of a Detailed Technical Report (2017), and currently, a Detailed Environmental Plan (PAD) under evaluation.
| April, 2022 |
SRK Consulting Peru SA SEC Technical Report Summary – El Brocal | Page 302 |
After reviewing the descriptive scope of the documents identified above, SRK has concluded that the main activities and components for mining and beneficiation at Colquijirca MU have obtained statutory Environmental Certifications. SRK has come to the same conclusion regarding the ancillary components of the mine
SRK’s review of available documents corroborates that the Colquijirca MU has the corresponding permits to develop its mining beneficiation activities.
The "Huaraucaca" beneficiation concession was approved by Directorial Resolution No. 143/83. Subsequently, extensions, amendments, and communications have been processed as required by the regulations in force at each opportunity.
SRK has verified that semiannual reports for the years 2018, 2019, and 2020 have been submitted to authorities and that said reports provide details on progressive compliance with the MCP.
It should be noted that the schedule of closure activities included in the MCPs, or their amendments, must be met to avoid administrative sanctions and triggering financial guarantees if progressive closure budgets are not executed.
Limited information was available in the approved closure plan and cost estimate regarding closure material quantities and how they were calculated. Because of the limited information available, particularly the lack of details as to how those costs were calculated basis for the unit rates, SRK cannot validate the cost estimate in the approved closure plan.
However, in order to assess the impact of changes in unit prices, SRK used the quantities and key parameters (e.g., topsoil haul distances and cover material thicknesses) that were included in the approved closure plan and assumptions where details were absent, and applied current unit rates for labor, equipment, and materials to those quantities. For example, the cost to excavate, haul and place low permeability cover material did not indicate how far the material would be hauled. In this case, we used published and internal equipment and labor rates, and estimated an average haul distance to update the cost.
Next, it is key to identify geographic aspects and determine the coefficient applicable to the set of unified prices used in the estimate (September 2021). The variant factor is the divergence between the unified prices recently updated and the closure plan (March 2020). Then the mentioned unified rates will be multiplied by an influence percentage that is weighed by importance. Finally, the average factor is calculated has a summary of every activity. For El Brocal, the resulting average factor is 1.30.
| April, 2022 |
SRK Consulting Peru SA SEC Technical Report Summary – El Brocal | Page 303 |
Recommendations |
Geological Setting, mineralization and Deposit |
| ● | SRK recommends developing a detailed structural model to provide further support to the geologic modeling of the deposit. |
Mineral Resources |
| ● | SRK recommends that systematic density sampling programs be carried out covering all ore bodies, adequately distributed along the length and height of the veins. |
| ● | QAQC results throughout the life of the mine have not been optimal. SRK recommends that the quality control program be properly monitored. Internal laboratory results over the last few months on Au and Cu show accuracy problems and potential problems on Ag. These inappropriate results generated the non-declaration of measured resources in the southern zone. |
| ● | SRK strongly suggests that a feasibility-level structural model be developed throughout the mine, especially in the southern area. Currently, the low confidence of the structural model means that the southern part does not have measured resources. |
| ● | SRK recommends implementing a reconciliation program where the different types of resource models, reserves, mine plans and plant results are included. |
Sample Preparation, Analysis and Security |
SRK recommends frequently analyzing the results of control samples, particularly with regard to the precision and accuracy of the Internal Laboratory and Certimin External Laboratory, to identify any inconsistencies and provide immediate solutions.
Data Verification |
SRK recommends performing internal validations of the database; conducting periodic verification of the data export process; and issuing Internal Laboratory analytical certificates for future estimations or audits.
Mining and Mineral Reserves |
| ● | Improvement of metallurgical recovery estimation by means of a continuous performance control of plant operations and development of additional metallurgical tests. SRK considers that current formulas are coherent with the processing plants and represent the results of the process, however, it is necessary to complete additional analysis. |
| ● | Develop a definition of metallurgical recovery schema for ore materials that can produce a bulk concentrate (Cu, Pb, Ag) and incorporate it as part of mineral reserves estimation. |
| ● | Improvement of “unit value” calculation by means the parameters traceability and adding some level of differentiation in the commercial terms, separating commercial terms related to the metal or payable content and commercial terms related to mass of concentrate |
| ● | Improve the predictability of Arsenic contents in the saleable products. |
| ● | Geotechnical monitoring of open pit slopes and implement feedback process to incorporate the monitoring results to the geotechnical model used for pit design purposes |
| ● | Implement a reconciliation process, following best practices of the industry. This process must be consider the involvement of areas: mine operations, geology, mine planning and processing plant under an structured plan of implementation; |
| April, 2022 |
SRK Consulting Peru SA SEC Technical Report Summary – El Brocal | Page 304 |
Environmental, Permitting, and Social Considerations |
Achieve the goals programmed in the social management plan that were pending due to the Covid 19 restrictions.
Capital and Operating Costs |
| ● | Development of additional technical studies related to the mine closure process, for improving the accuracy of cost estimation. SRK considers that there are opportunities to improve and reduce the closure costs supported by technical studies; |
| ● | Continuo monitoring of cost results (yearly, quarterly) and use these results for feedback on the operating and capital cost estimation; |
| ● | Complete the studies for the cemented backfill and based on that, update the capital cost requirements. |
| ● | Develop a detailed cost estimation for the production of bulk concentrate. |
| April, 2022 |
SRK Consulting Peru SA SEC Technical Report Summary – El Brocal | Page 305 |
24 | References |
Baumgartner, R., Fontboté, L., & Vennemann, T. (2007). Mineral Zoning and Geochemistry of Epithermal Polymetallic Zn-Pb-Ag-Cu-Bi Mineralization at Cerro de Pasco, Peru. Society of Economic Geologists, Inc., 493–537.
Bendezú, R., & Fontboté, L. (2002). UNIVERSITÉ DE GENÈVE - FACULTÉ DES SCIENCES, SECTION DES SCIENCES DE LA TERRE. Obtenido de Late timing for high sulfidation cordilleran base metal lode and replacement deposits in porphyry-related districts: the case of Colquijirca, central Peru: https://www.unige.ch/sciences/terre/research/Groups/mineral_resources/archive/pub_archive/sga2002/sga2002.html
Bendezú, R., Fontboté, L., & Cosca, M. (2003). Relative age of Cordilleran base metal lode and replacement deposits, and high sulfidation Au–(Ag) epithermal mineralization in the Colquijirca mining district, central Peru. Mineralium Deposita, 683-694.
Bendezú, R., Page, L., Spikings, R., Pecskay, Z., & Fonboté, L. (2008). New 40Ar/39Ar alunite ages from the Colquijirca district, Peru: evidence of a long period of magmatic SO2 degassing during formation of epithermal Au–Ag and Cordilleran polymetallic ores. Miner Deposita (2008), 777–789.
Buenaventura. (2021). Buenaventura. Obtenido de https://www.buenaventura.com/
Buenaventura. (2021). Reporte de Estimación de Recursos.
Buenaventura. (2021). Reporte de Estimación de Recursos.
El Brocal. (2019). Obtenido de https://www.elbrocal.pe/operaciones.html
El Brocal. (2020). Reporte de Sostenibilidad. Sociedad Minera el Brocal S.A.A.
El Brocal. (2021). Geología del Distrito Minero: Colquijirca. Sociedad Minera El Brocal S.A.A.
Ellis Geophysical Consulting Inc. (2003). Acquisition Review and Interpretation of 2003 Gravity Survey - Cerro Marcapunta Project, Pasco, Perú. Ellis Geophysical Consulting Inc.
INGEMMET. (2011). Geología del Cuadrángulo de Cerro de Pasco, Hoja 22-k, Boletín N° 144 Serie A, Carta Geológica Nacional, Escala 1:50,000. Lima.
INGEMMET. (2021). Plataforma digital única del Estado Peruano. Obtenido de Concesiones Mineras: https://www.gob.pe/institucion/ingemmet/colecciones/1880-concesiones-mineras
SRK. (2021). Reporte de Estimación de Recursos .
Territorio y Medio Ambiente S.A.C. (2019). Quinto Informe Técnico Sustentatorio de la Unidad Minera Colquijirca. Territorio y Medio Ambiente S.A.C.
Ventura, M. (2020). Memorandum - Revisión Geológica del Tajo Colquijirca y Sondajes. Buenaventura.
| April, 2022 |
SRK Consulting Peru SA SEC Technical Report Summary – El Brocal | Page 306 |
Reliance on Information Provided by the Registrant |
Introduction |
The QPs fully relied on the registrant for the guidance in the areas noted in the following sub-sections. Buenaventura has active mining operations in Peru and has considerable experience in developing mining operations in the jurisdiction.
The QPs undertook checks that the information provided by the registrant was suitable to be used in the Report.
Macroeconomic Trends |
Information relating to inflation, interest rates, discount rates, foreign exchange rates and taxes.
This information is used in the economic analysis in Chapter 19. It supports the Mineral Resources estimate in Chapter 11, and the mineral reserve estimate in Chapter 12.
Markets |
Information relating to market studies/markets for product, market entry strategies, marketing and sales contracts, product valuation, product specifications, refining and treatment charges, transportation costs, agency relationships, material contracts (e.g., mining, concentrating, smelting, refining, transportation, handling, hedging arrangements, and forward sales contracts), and contract status (in place, renewals).
This information is used when discussing the market, commodity price and contract information in Chapter 16, and in the economic analysis in Chapter 19. It supports the Mineral Resources estimate in Chapter 11, and the mineral reserve estimate in Chapter 12.
Legal Matters |
Information relating to the corporate ownership interest, the mineral tenure (concessions, payments to retain, obligation to meet expenditure/reporting of work conducted), surface rights, water rights (water take allowances), royalties, encumbrances, easements and rights-of-way, violations, and fines, permitting requirements, ability to maintain and renew permits
This information is used in support of the property ownership information in Chapter 3, the permitting and closure discussions in Chapter 17, and the economic analysis in Chapter 19. It supports the Mineral Resources estimate in Chapter 11, and the mineral reserve estimate in Chapter 12.
Environmental Matters |
Information relating to baseline and supporting studies for environmental permitting, environmental permitting and monitoring requirements, ability to maintain and renew permits, emissions controls, closure planning, closure and reclamation bonding and bonding requirements, sustainability accommodations, and monitoring for and compliance with requirements relating to protected areas and protected species.
This information is used when discussing property ownership information in Chapter 3, the permitting and closure discussions in Chapter 17, and the economic analysis in Chapter 19. It
| April, 2022 |
SRK Consulting Peru SA SEC Technical Report Summary – El Brocal | Page 307 |
supports the Mineral Resources estimate in Chapter 11, and the mineral reserve estimate in Chapter 12.
Stakeholder Accommodations |
Information relating to social and stakeholder baseline and supporting studies, hiring and training policies for workforce from local communities, partnerships with stakeholders (including national, regional, and state mining associations; trade organizations; fishing organizations; state and local chambers of commerce; economic development organizations; non-government organizations; and regional and national governments), and the community relations plan.
This information is used in the social and community discussions in Chapter 17, and the economic analysis in Chapter 19. It supports the Mineral Resources estimate in Chapter 11, and the mineral reserve estimate in Chapter 12.
Governmental Factors |
Information relating to taxation and royalty considerations at the Project level, monitoring requirements and monitoring frequency, bonding requirements.
This information is used in the economic analysis in Chapter 19. It supports the Mineral Resources estimate in Chapter 11, and the mineral reserve estimate in Chapter 12.
| April, 2022 |